


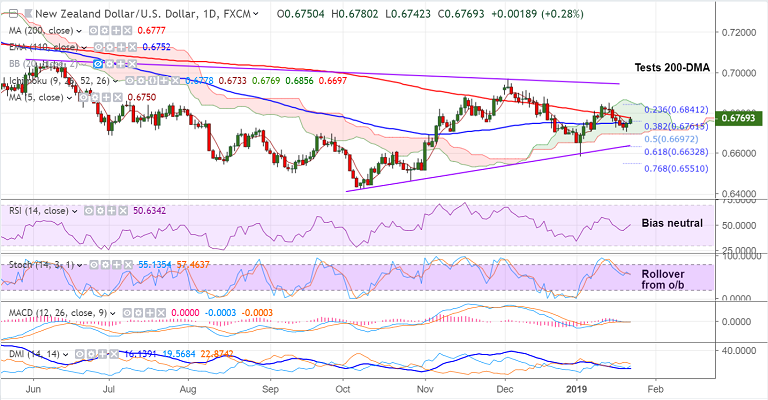
NZD/USD chart on Trading View used for analysis
- NZD/USD is extending retrace from 2-week lows at 0.6707 hit on Tuesday's trade.
- The pair is trading 0.27% higher on the day at 0.6767 at 0400 GMT.
- The bird buoyed after New Zealand inflation numbers surprised to the upside.
- That said, the beat was marginal at best and it is unlikely to shift the status quo at the RBNZ.
- Deteriorating global growth picture and recent IMF warnings/ downgrades could keep upside limited.
- Technical bias remains bearish, price action below major moving averages, 5-DMA is sharply lower.
- 200-DMA is major resistance at 0.6777 and any meaningful upside only on decisive break above.
- Immediate support lies at 5-DMA at 0.6750. Break below eyes cloud base support at 0.6697. Violation there will see drag till trendline support at 0.6640.
Support levels - 0.6750 (nearly converged 5-DMA and 110-EMA), 0.6697 (cloud base), 0.6640 (trendline)
Resistance levels - 0.6777 (200-DMA), 0.68, 0.6848 (Jan 15 high)
For details on FxWirePro's Currency Strength Index, visit http://www.fxwirepro.com/currencyindex.


