


Chart - Courtesy Trading View
Spot Analysis:
NZD/USD was trading 0.15% higher on the day at 0.6813 at around 10:20 GMT
Previous Week's High/ Low: 0.7013/ 0.6804
Previous Session's High/ Low: 0.6867/ 0.6802
Technical Analysis:
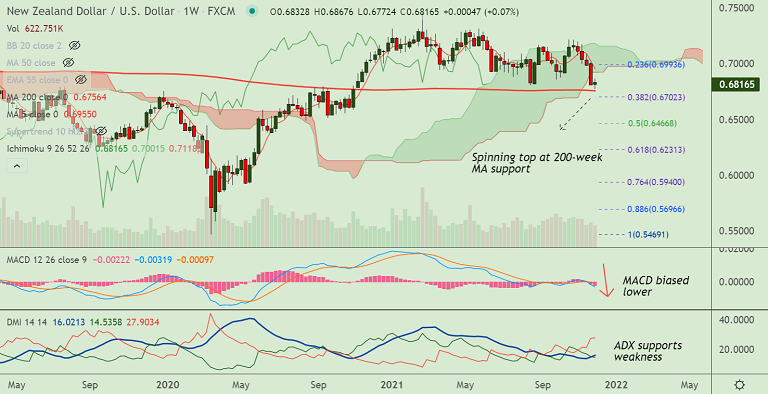
- Momentum bearish, Stochs and RSI in oversold zone, but no sign of reversal
- Price action is below major moving averages which are trending lower
- The pair has formed a Spinning Top on the weekly candle, finds strong support at 200-week MA
- Volatility is high and rising as evidenced by widening Bollinger bands
Major Support and Resistance Levels:
Support - 0.6756 (200-week MA), Resistance - 0.6815 (5-DMA)
Summary: NZD/USD trades with a bearish bias, but finds strong support at 200-week MA. Watch out for decisive break below for further weakness.


