


, focus on GDT price action for impetus - EconoTimes)


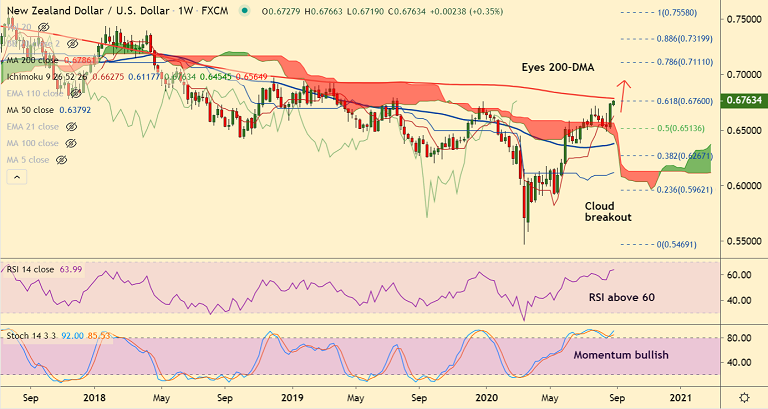
NZD/USD chart - Trading View
Technical Analysis: Bias Bullish
GMMA Indicator
- Major and minor trend is strongly bullish on the daily charts
- On the weekly charts, minor trend is bullish, major trend is turning bullish
Ichimoku Analysis
- Price action has bounced off daily cloud and is extending gains above weekly cloud
- Chikou span is biased higher suggesting upside continuation
Oscillators
- Oscillators are bullishly aligned on daily and weekly charts
- Overbought levels may cause some pullbacks, no signs of reversal
Bollinger Bands
- Bollinger bands are widening on the daily and weekly charts
- Volatility is high raising scope for further gains
Major Support Levels: 0.6698 (5-DMA), 0.6622 (21-EMA)
Major Resistance Levels: 0.6760 (61.8% Fib), 0.6786 (200W MA)
Summary: Major trend is bullish. Stiff resistance at 200W MA and overbought oscillators could cause some weakness. Decisive breakout at 200W MA to propel the pair higher. Next major bullish target lies at 0.6980 (110M EMA) ahead of 78.6% Fib at 0.7111.


