


NZD/USD chart - Trading View
- NZD/USD is trading rangebound on the day at 0.6730 at 0435 GMT.
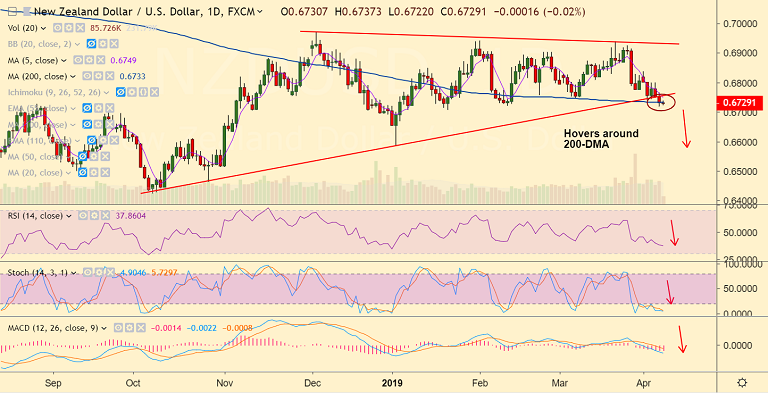
- The pair hovers around 200-DMA at 0.6733, decisive break below will see further weakness.
- Technical indicators are biased lower, momentum oscillators are highly bearsih.
- MACD supports downside and Bollinger bands are widening in support of downtrend.
- Price has broken major trendline support at 0.6750, break below 200-DMA will see weakness till 61.8% Fib at 0.6632.
- Bounce off 200-DMA and retrace above 110-EMA will see upside.
Support levels - 0.6696 (50% Fib), 0.6632 (61.8% Fib)
Resistance levels - 0.6750 (5-DMA), 0.6761 (38.2% Fib), 0.6794 (110-EMA)
Recommendation: Stay short on break below 200-DMA, SL: 0.6755, TP: 0.67/ 0.6635
For details on FxWirePro's Currency Strength Index, visit http://www.fxwirepro.com/currencyindex.


