


NZD/USD chart - Trading View
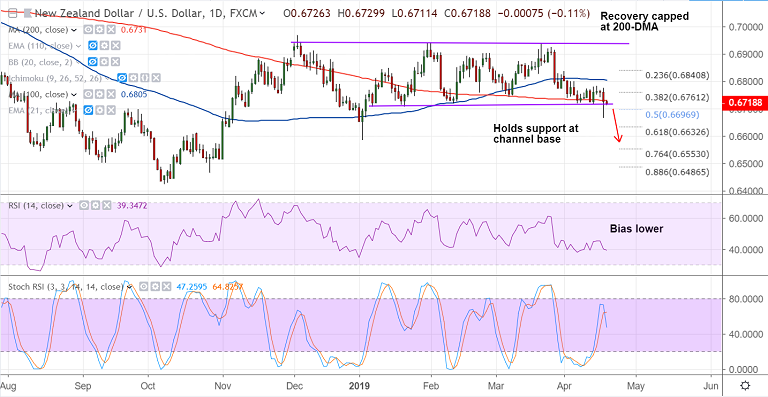
- NZD/USD is extending weakness below 200-DMA, trades 0.07% lower on the day at 0.6721 at 0520 GMT.
- Price action below cloud and major EMAs on the daily chart and recovery capped below 200-DMA.
- The pair trades in a sloping channel pattern and is currently holding support at channel base at 0.6715.
- Technical indicators are biased lower. RSI is below 50 and supports downside.
- Breach at channel base to see further downside. Scope for dip till 61.8% Fib at 0.6632.
- Upside finds stiff resistance at 21-EMA, break above to see minor upside. Break above 100-DMA negates bearishness.
Support levels - 0.6715 (channel base), 0.6696 (50% Fib), 0.6632 (61.8% Fib)
Resistance levels - 0.6732 (200-DMA), 0.6746 (5-DMA), 0.6771 (21-EMA)
Recommendation: Good to go short on break below 0.6715, SL: 0.6750, TP: 0.6695/ 0.6635
For details on FxWirePro's Currency Strength Index, visit http://www.fxwirepro.com/currencyindex.


