


NZD/USD chart - Trading View
- NZD/USD is holding marginal gains on the day on broad-based U.S. dollar weakness.
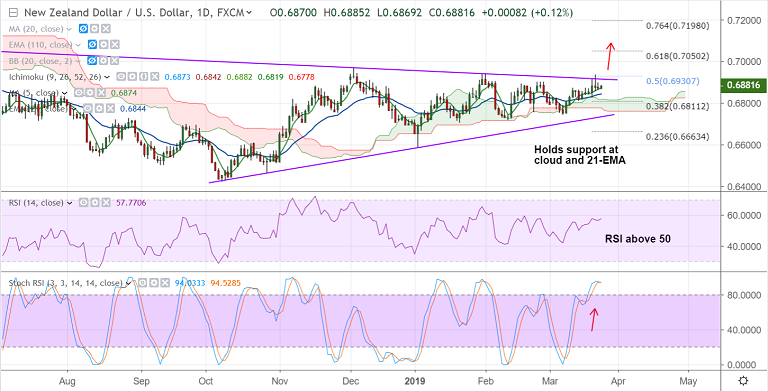
- The pair is trading in an 'Symmetric Triangle' pattern and bias is slightly bullish.
- Price action is extending bounce off 200-DMA and has edged above daily cloud.
- Falling U.S. Treasury yields and decline in U.S. stock market weigh on the dollar.
- Focus today on U.S. Chicago national activity index and Dallas Fed manufacturing business index.
- New Zealand imports, trade balance, exports (Tuesday) and RBNZ interest rate decision (Wed) will also be watched for further direction.
- Strong resistance is seen at 0.6915 (trendline). Break above will see gains till 200W SMA at 0.6931. Further upside only on decisive break above.
- 21-EMA is strong support at 0.6844, break below daily cloud will see near-term weakness.
Support levels - 0.6874 (5-DMA), 0.6844 (21-EMA), 0.6811 (38.2% Fib)
Resistance levels - 0.69, 0.6915 (trendline), 0.6930 (nearly converged 50% Fib and 200-W SMA)
For details on FxWirePro's Currency Strength Index, visit http://www.fxwirepro.com/currencyindex.


