


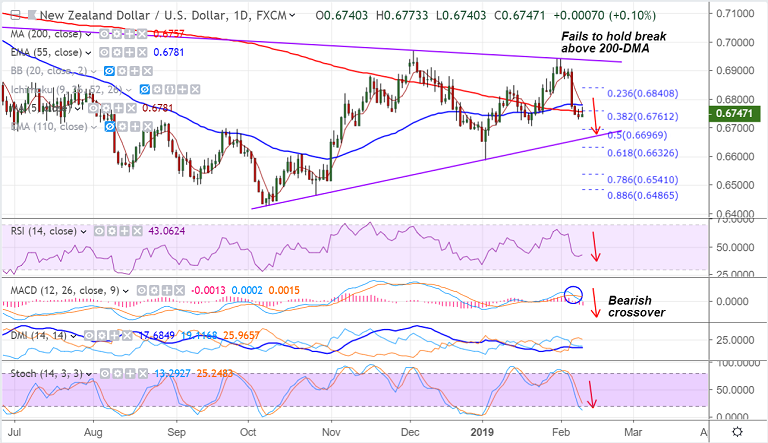
NZD/USD chart on Trading View used for analysis
- NZD/USD edges lower from session highs at 0.67733, intraday bias bearish.
- The pair is currently trading at 0.6748, up 0.11% at the time of writing.
- Price action failed to hold break above 200-DMA, scope for further weakness.
- Stochs are sharply lower, RSI is below 50, MACD shows a bearish crossover on signal line.
- Next major support lies at 0.6660 (major trendline). Violation there could see test of 61.8% Fib.
- We see stiff resistance in 0.6757 to 0.6781 zone. Break above could see upside resumption.
- Focus now on the RBNZ Monetary Policy Statement for further impetus. A dovish outcome would likely spark a fresh wave of selling around the kiwi.
For details on FxWirePro's Currency Strength Index, visit http://www.fxwirepro.com/currencyindex.


