


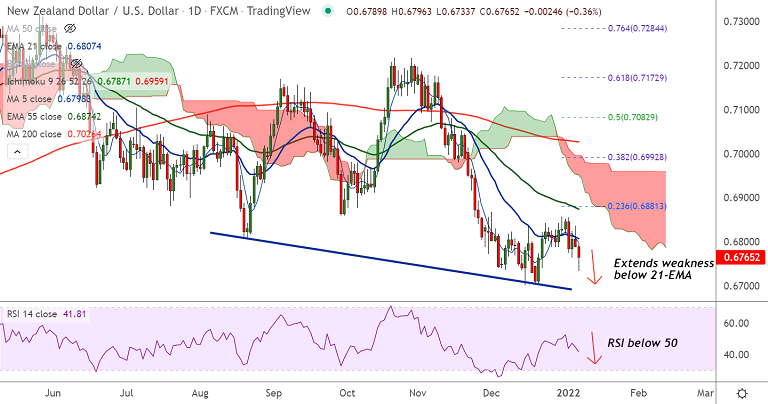
Chart - Courtesy Trading View
NZD/USD was trading 0.38% lower on the day at 0.6764 at around 10:40 GMT.
The pair is extending weakness for the 2nd straight session after finding rejection at 21-EMA.
GMMA indicator shows major and minor trend are bearish on the daily charts.
Momentum is bearish. Stochs have shown a bearish rollover from overbought levels and RSI is below 50 mark.
Price action is below the daily cloud and Chikou span is biased lower. MACD is on verge of bearish crossover on signal line.
Support levels - 0.6743 (200-week MA), 0.6702 (38.2% Fib), 0.6685 (Trendline support)
Resistance levels - 0.6788 (20-DMA), 0.6798 (5-DMA), 0.6807 (21-EMA)
Summary: NZD/USD finds strong support at 200-week MA. Technical bias is bearish. Break below will plummet prices.


