


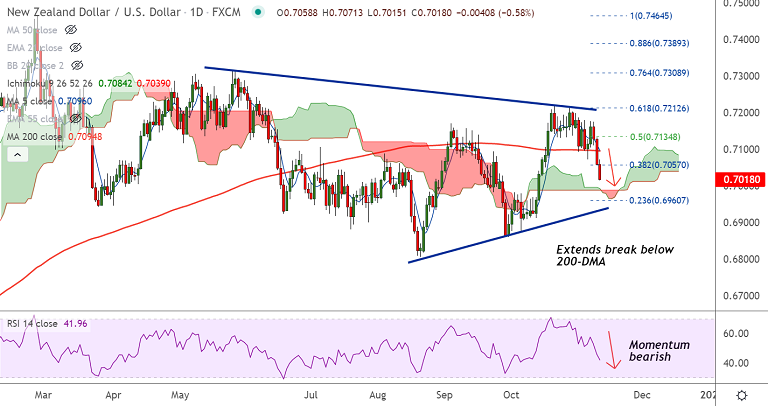
NZD/USD chart - Courtesy Trading View
Technical Analysis: Bias Bearish
- NZD/USD extends slump for the 3rd consecutive session
- The major was trading 0.58% lower on the day at 0.7017 at around 09:40 GMT
- Price action is extending previous session's break below 200-DMA
- Momentum is strongly bearish, Stochs and RSI are sharply lower
- MACD and ADX supports weakness, volatility is high and rising
Data Released:
US consumer price index surged 6.2% from a year ago in October, the most since December 1990.
Core inflation, stripping out food and energy, increased 4.6%, the fastest gain since August 1991.
Support levels - 0.6992 (daily cloud), 0.6960 (23.6% Fib), 0.6936 (trendline)
Resistance levels - 0.7057 (38.2% Fib), 0.7094 (200-DMA), 0.71
Summary: NZD/USD close below 200-DMA has opened downside. Test of cloud support on cards. Breach below cloud will plummet prices further.


