


NZD/USD chart - Trading View
NZD/USD starts the week on a bearish note, extends previous weeks' upbeat US GDP led weakness.
The US economy expanded by 2.1% annualized pace in Q2, keeping the USD well supported across the board.
The incoming stronger US economic data further reinforced expectations that the Fed is unlikely to cut rates at its upcoming meeting on July 30-31.
Rising US bond yields further underpin the greenback, likely to maintain downward pressure on the major.
Renewed optimism over a possible resolution of the prolonged US-China trade disputes keep downside limited for now.
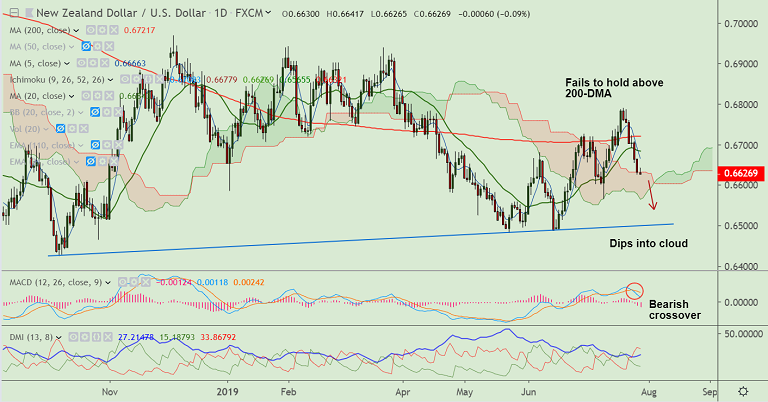
NZD/USD pauses downside at 0.6626. Technical bias remains bearish. Scope for further downside.
Price action has dipped into daily cloud and recovery attempts capped at 21H EMA. Next major bear target lies at lower Bollinger band at 0.6586.
Immediate resistance is seen at 55-EMA at 0.6655. Decisive break above could see retest of 200-DMA (0.6721.
Support levels - 0.6586 (Lower BB), 0.6565 (July 10 low), 0.65
Resistance levels - 0.6655 (55-EMA), 0.6684 (20-DMA), 0.6721 (200-DMA)
For details on FxWirePro's Currency Strength Index, visit http://www.fxwirepro.com/currencyindex.


