


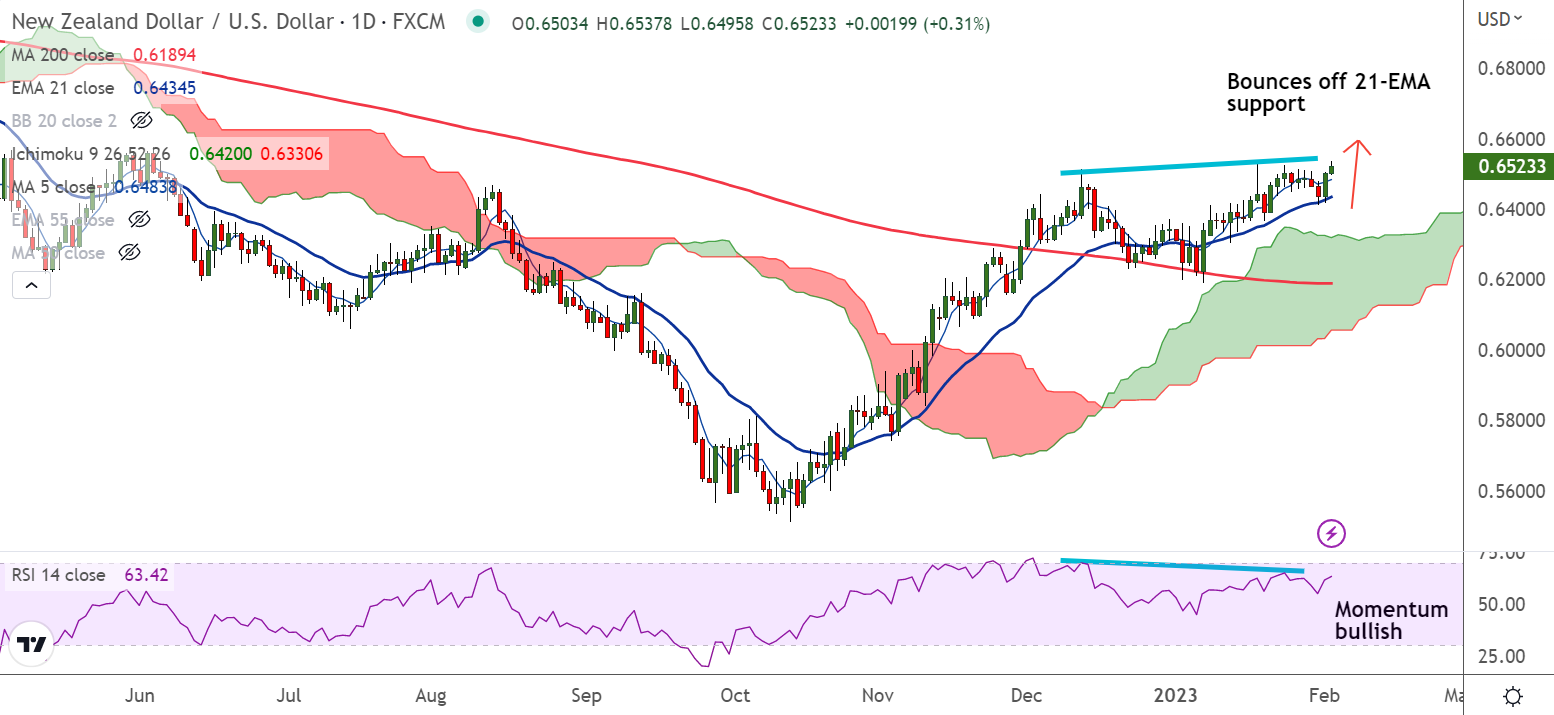
Chart - Courtesy Trading View
Technical Analysis:
- NZD/USD was trading 0.23% higher on the day at 0.6519 at around 13:10 GMT
- The pair is extending gains for the second straight session after bounce off 21-EMA support on Wednesday
- Price action is above daily cloud and Chikou span is biased higher
- GMMA indicator shows major and minor trend are bullish
- Momentum is bullish, MACD and ADX support upside in the pair
- Bearish RSI divergence on the daily charts keeps scope for downside
Support levels:
S1: 0.6482 (5-DMA)
S2: 0.6434 (21-EMA)
Resistance levels:
R1: 0.6544 (Upper BB)
R2: 0.6613 (200-week MA)
Summary: NZD/USD trades with a bullish bias. The pair is poised to test 200-week MA at 0.6613. On the flipside, break below 21-EMA will see dip till daily cloud. Major weakness only below 200-DMA.


