


Chart - Courtesy Trading View
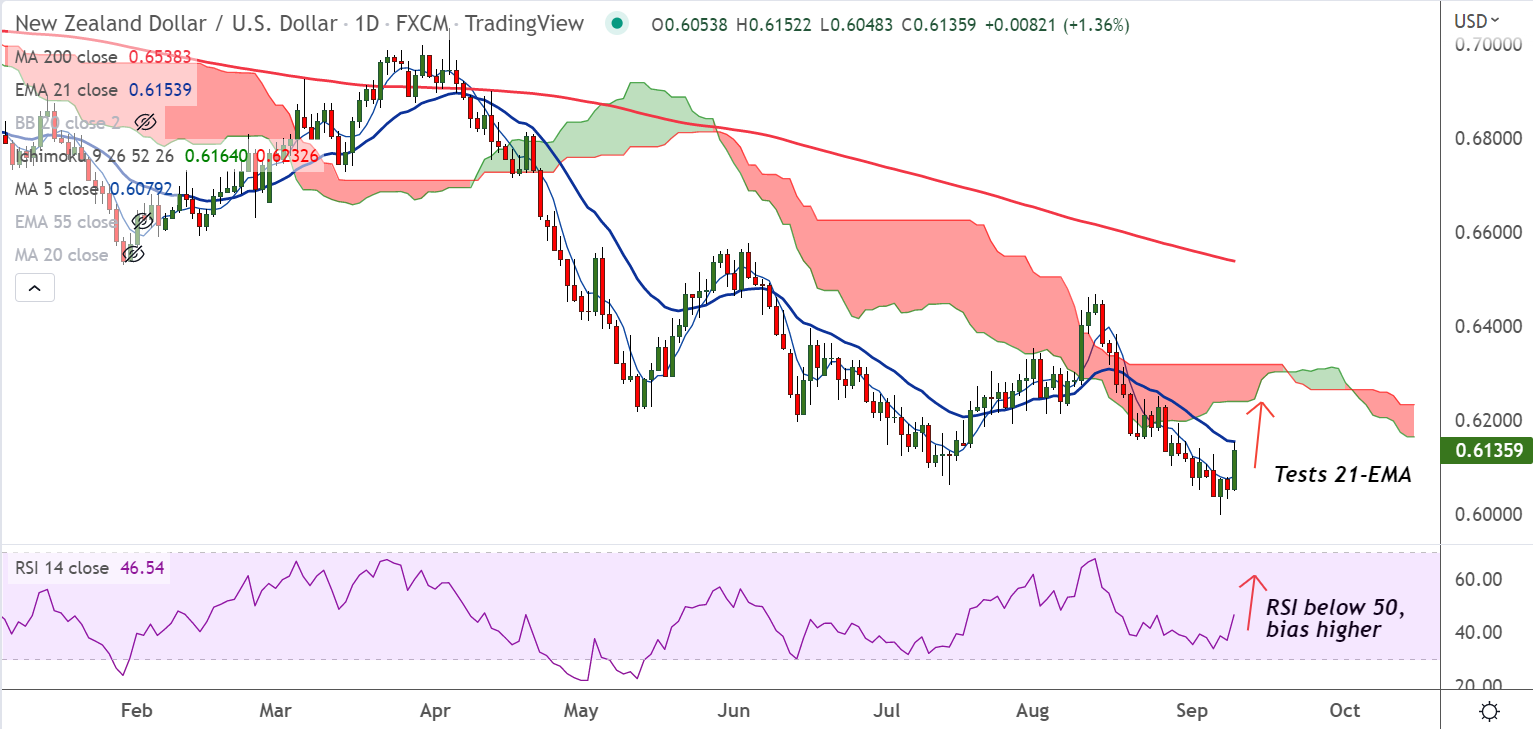
NZD/USD was trading 1.32% higher on the day at 0.6134 at around 09:15 GMT.
The pair has broken above 5-DMA and 200H MA on the intraday charts.
On the data front, US Weekly Initial Jobless Claims slumped to the lowest levels since May, with the latest figures beyond 222K.
With no major market-moving economic data due for release from the US, focus will be on Fed speak for imeptus.
GMMA indicator shows major and minor trend are bearish on the daily charts, but are turning bullish on the intraday charts.
Momentum is turning bullish. RSI is biased higher, Stochs are on verge of bullish rollover from oversold levels.
MACD is on verge of bullish crossover on signal line. Chikou span is biased higher.
Support levels - 0.6080 (5-DMA), 0.5989 (Lower BB)
Resistance levels - 0.6154 (21-EMA), 0.6166 (20-DMA)
Summary: NZD/USD testing 21-EMA resistance, decisive break above will propel the pair higher.


