


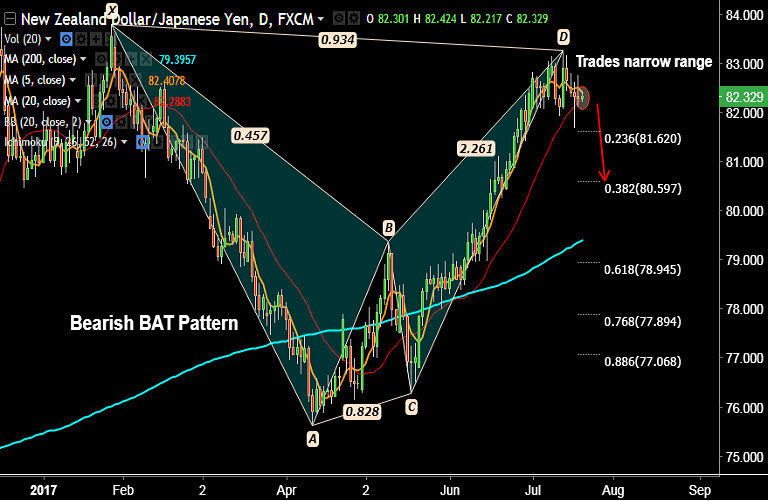
- NZD/JPY is trading in a narrow range. The pair is hovering around 20-DMA at 82.28.
- Technical indicators support downside in the pair. MACD has shown a bearish crossover and Stochs are biased lower.
- We see a 'Bearish Bat Pattern' on daily charts, raises scope for downside in the pair.
- Back-to-back Doji formations on weekly charts add to downside bias.
- Decisive close below 20-DMA could see downside, drag upto 38.2% Fib of 76.270 to 83.272 rally) then likely.
Support levels - 82.24 (Weekly 5-SMA), 82.28 (20-DMA), 81.67 (July 18 low)
Resistance levels - 82.87 (88.6% Fib retrace of 83.809 to 75.626 fall), 83, 83.27 (July 13 high)
Recommendation: Good to go short on close below 20-DMA, SL: 82.60, TP: 81.70/ 81/ 80.70
FxWirePro Currency Strength Index: FxWirePro's Hourly NZD Spot Index was at -156.743 (Bearish), while Hourly JPY Spot Index was at -22.4518 (Neutral) at 0650 GMT. For more details on FxWirePro's Currency Strength Index, visit http://www.fxwirepro.com/currencyindex.
FxWirePro launches Absolute Return Managed Program. For more details, visit http://www.fxwirepro.com/invest


