


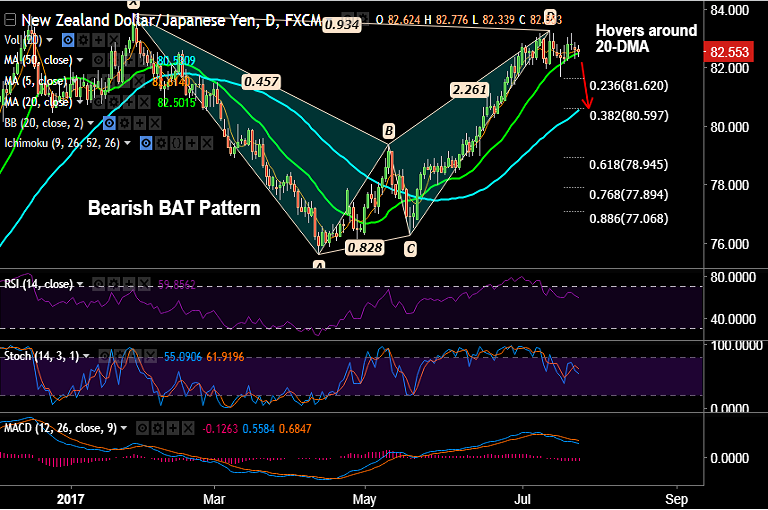
- NZD/JPY hovers around 20-DMA at 82.50, extends range trade above weekly 200-SMA.
- 'Bearish Bat Pattern' on daily charts raises scope for downside in the pair.
- Break below weekly 200-SMA at 82.27 will accentuate weakness.
- Technical indicators support downside in the pair, Stochs and RSI are biased lower.
- Doji and spinning top formations on weekly charts add to downside bias. RSI on the weeklies has also turned south.
Support levels - 82.27 (Weekly 200-SMA), 81.62 (23.6% Fib retrace of 76.270 to 83.272 rally), 80.66 (Feb 9th low)
Resistance levels - 82.60 (5-DMA), 83, 83.27 (July 13 high)
Recommendation: Watch out for break below weekly 200-SMA to go short.
FxWirePro Currency Strength Index: FxWirePro's Hourly NZD Spot Index was at 5.14025 (Neutral), while Hourly JPY Spot Index was at 163.347 (Bullish) at 0700 GMT. For more details on FxWirePro's Currency Strength Index, visit http://www.fxwirepro.com/currencyindex.
FxWirePro launches Absolute Return Managed Program. For more details, visit http://www.fxwirepro.com/invest


