


NZD/JPY chart - Trading View
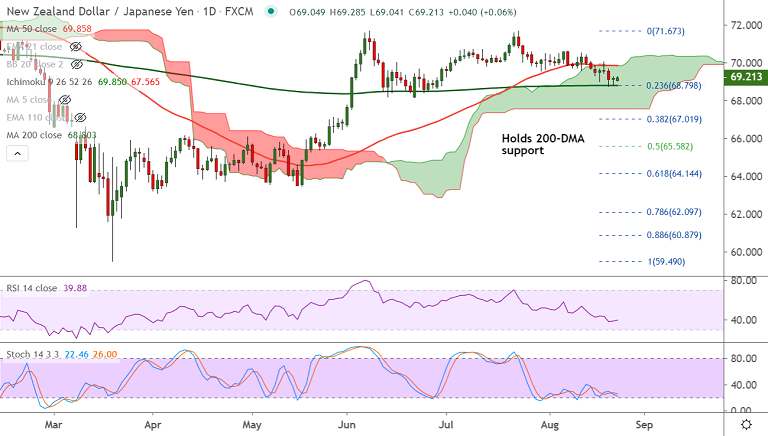
NZD/JPY was trading 0.04% higher on the day at 69.19 at around 09:50 GMT.
The pair is extending bounce off 200-DMA support and weakness only on break below.
Near-term bias has turned bearish as evidenced by GMMA indicator and the pair trades below 200H MA.
Kiwi depressed after the New Zealand government announced an extension of lockdown in Auckland till August 30.
Price action is within daily cloud and break below 200-DMA will open downside. Scope for test of 38.2% Fib at 67.01.
On the flipside, breakout above cloud and 21-EMA will change bias bullish.
Support levels - 68.80 (200-DMA), 68.86 (110-EMA), 67.01 (38.2% Fib)
Resistance levels - 69.42 (55-EMA), 69.59 (200H MA), 69.75 (21-EMA)


