


 UBS Predicts Potential Fed Rate Cut Amid Strong US Economic Data
  U.S. Stocks vs. Bonds: Are Diverging Valuations Signaling a Shift?
  Indonesia Surprises Markets with Interest Rate Cut Amid Currency Pressure
  Energy Sector Outlook 2025: AI's Role and Market Dynamics
  China's Refining Industry Faces Major Shakeup Amid Challenges
  Goldman Predicts 50% Odds of 10% U.S. Tariff on Copper by Q1 Close
  Gold Prices Fall Amid Rate Jitters; Copper Steady as China Stimulus Eyed
  U.S. Banks Report Strong Q4 Profits Amid Investment Banking Surge
  Trump’s "Shock and Awe" Agenda: Executive Orders from Day One
  Wall Street Analysts Weigh in on Latest NFP Data


NZD/JPY chart on Trading View used for analysis
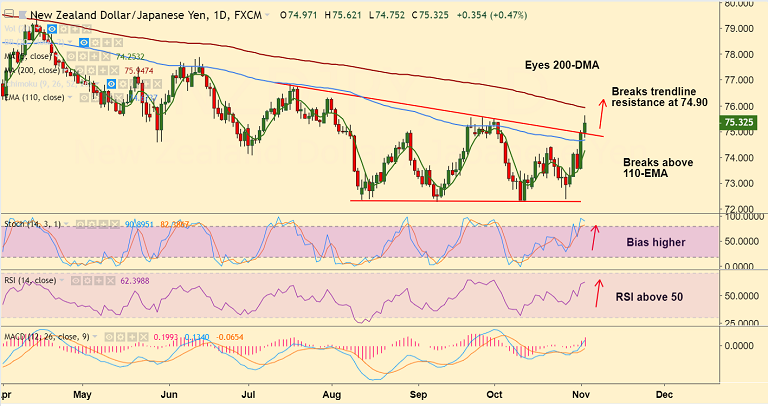
- NZD/JPY hits 3-month highs at 75.62 before paring some gains to currently trade at 75.22.
- Technical analysis shows bullish bias. Stochs and RSI are sharply higher and MACD supports upside.
- The pair has spiked past 55-EMA and has broken above major trendline resistance at 74.90.
- Volatility is rising as suggested by widenning Bollinger Bands. Price action has edged above major EMAs.
- Next bull target lies at 200-DMA at 75.95 ahead of 76.30 (Aug 1 high).
- We see weakness only on retrace below 110-EMA at 74.67.
Support levels - 74.67 (110-EMA), 74.45 (23.6% Fib)
Resistance levels - 75.54 (21, 26th Sept), 75.81 (38.2% Fib)
Call update: Our previous call (https://www.econotimes.com/FxWirePro-NZD-JPY-Trade-Idea-1451943) has hit all targets.
Recommendation: Book partial profits, trail SL to 74.85, target 75.80/ 75.95
For details on FxWirePro's Currency Strength Index, visit http://www.fxwirepro.com/currencyindex.


