


NZD/JPY chart on Trading View used for analysis
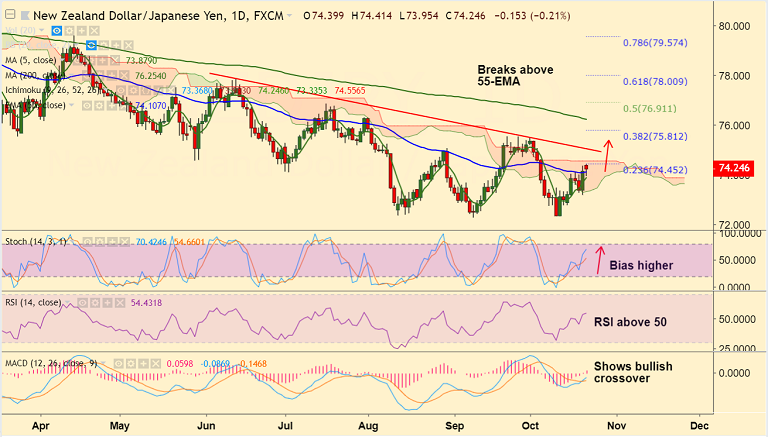
Technical Analysis: Bias Bullish
- Extends breaks into cloud and above 21-EMA
- Breaks above 55-EMA and pauses just shy of 23.6% Fib
- Stocks and RSI are biased higher, RSI has edged above 50 level
- MACD now shows a bullish crossover on signal line
Support levels - 74.10 (55-EMA), 73.86 (5-DMA)
Resistance levels - 74.45 (23.6% Fib), 75 (Tendline)
Recommendation: Stay long on dips, SL: 73.75, TP: 74.45/ 75
For details on FxWirePro's Currency Strength Index, visit http://www.fxwirepro.com/currencyindex.

- News

- Economy

- Central Banks
- Investing
- Research
- Roundups
- Digital Currency
- Insights
- Technical Analysis
- Technology
- Business
- Law
- Health
- Nature
- Fintech
- Science
- Topic
- Opinions
- ©Econometrics LLC . All Rights Reserved.
FxWirePro: NZD/JPY Trade Idea
Monday, October 22, 2018 11:31 AM UTC
Editor's Picks


- Market Data
Most Popular


