


 Moldova Criticizes Russia Amid Transdniestria Energy Crisis
  Gold Prices Slide as Rate Cut Prospects Diminish; Copper Gains on China Stimulus Hopes
  Geopolitical Shocks That Could Reshape Financial Markets in 2025
  Trump’s "Shock and Awe" Agenda: Executive Orders from Day One
  Gold Prices Fall Amid Rate Jitters; Copper Steady as China Stimulus Eyed
  Stock Futures Dip as Investors Await Key Payrolls Data
  S&P 500 Relies on Tech for Growth in Q4 2024, Says Barclays
  European Stocks Rally on Chinese Growth and Mining Merger Speculation


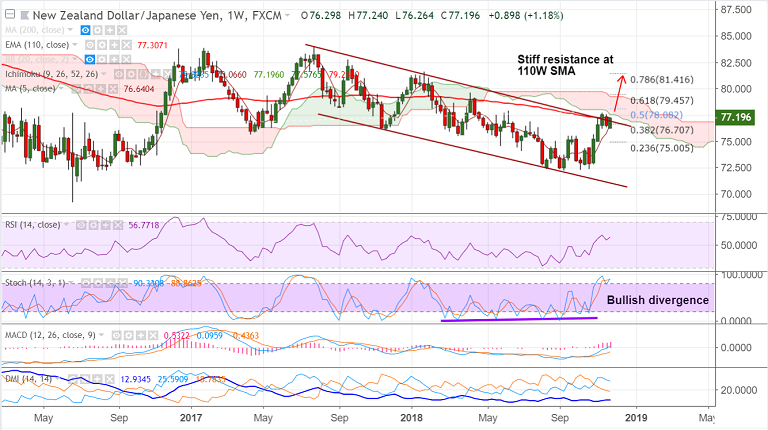
NZD/JPY chart on Trading View used for analysis
- NZD/JPY is attempting breakout of sloping channel pattern.
- The pair has been extending choppy trade at 110-W EMA resistance.
- We are seeing a grind along channel top and breakout there could see bullish continuation.
- A bullish divergence on Stochs on the weekly charts adds to upside scope.
- Breakout at 110-W EMA finds next major resistance at weekly cloud at 77.57.
- On the flipside, 76.64 (5W SMA is immediate support), weakness likely on break below.
Support levels - 76.63 (5W SMA), 75 (23.6% Fib)
Resistance levels - 77.30 (110-W EMA), 77.57 (weekly cloud base), 79.45 (61.8% Fib)
For details on FxWirePro's Currency Strength Index, visit http://www.fxwirepro.com/currencyindex.


