


NZDJPY forms shooting star patterns quite often at 69.861, 69.566 and 69.532 levels.
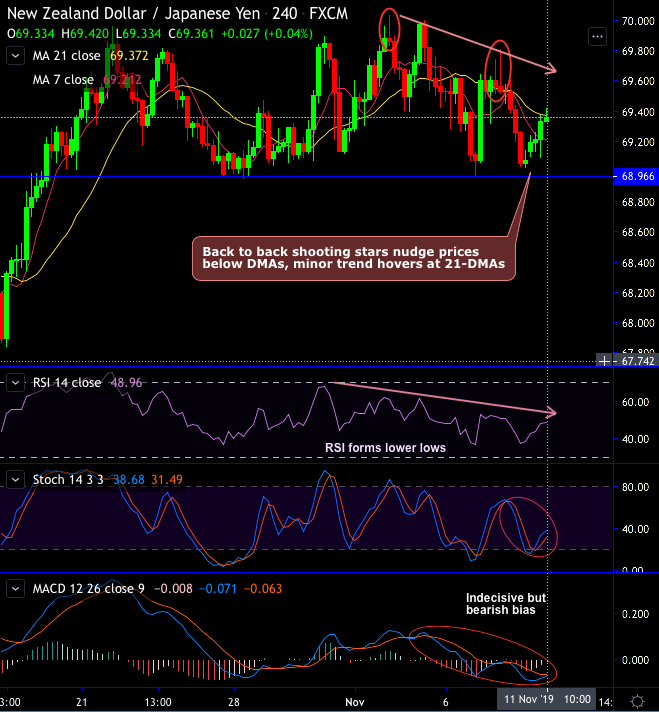
Back-to-back shooting stars plummet prices below DMAs in the minor trend (refer oval shaped area on the daily chart). From the last 4-5 days, mild upswings are observed, but, it seems unwise to get bull-trapped by the momentary upswings as both momentum & trend indicators are still bearish bias.
Both RSI and fast stochastic curves show downward convergence to the price slumps to indicate the strength in downtrend and intensified selling momentum. While MACD & DMAs are indecisive but bearish bias.
On a broader perspective, to substantiate the above standpoint, the major downtrend was sliding through the falling wedge (refer weekly chart).
The shooting star has occurred at 68.992 levels, on this timeframe as well, that intensifies major downtrend below EMAs, this bearish pattern nudges price below EMAs. Bears resume at wedge resistance by showing failure swings. Overall, both minor and major trends seem to show renewed weakness.
Hence, shorts in the mid-month futures have already been advocated with a view of arresting the downside risks. We wish to uphold the same short hedge strategy of mid-month tenor that was advocated in our previous post.
Alternatively, one can also buy tunnel options spreads with upper strikes at 69.477 and lower strikes at 69.334 levels on the trading grounds (spot reference: 69.396).


