


 Urban studies: Doing research when every city is different
  U.S. Treasury Yields Expected to Decline Amid Cooling Economic Pressures
  Trump’s "Shock and Awe" Agenda: Executive Orders from Day One
  US Futures Rise as Investors Eye Earnings, Inflation Data, and Wildfire Impacts
  UBS Predicts Potential Fed Rate Cut Amid Strong US Economic Data
  U.S. Banks Report Strong Q4 Profits Amid Investment Banking Surge
  Indonesia Surprises Markets with Interest Rate Cut Amid Currency Pressure


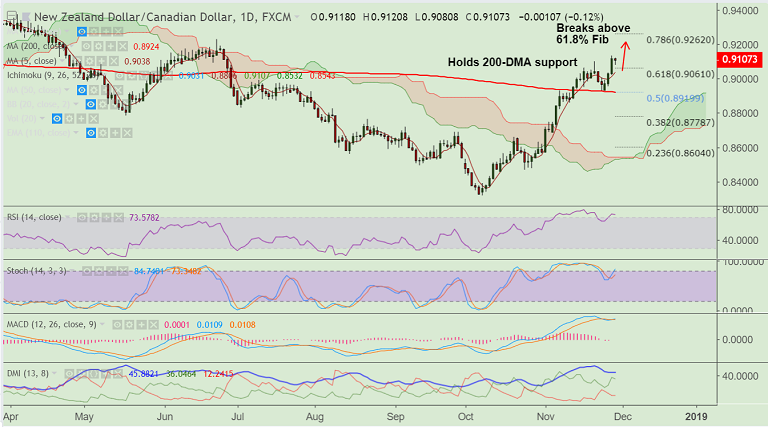
NZD/CAD chart on Trading View used for analysis
- NZD/CAD has hit 5-month highs at 0.9134 on Wednesday's trade, bias higher.
- The pair is extedning a bounce off strong support at 200-DMA and has broken above 61.8% Fib retracement.
- Price action has broken above stiff resistance at 200W SMA at 0.9077, raising scope for further gains.
- Momentum strongly bullish on the daily charts. Technical studies are turning bullish on weekly charts.
- Impressive upside economic surprises from New Zealand, such as jobs/CPI and GDP likely to support the kiwi.
- Next bull target lies at 0.9227, while we see weakness till 0.88 on break below 200-DMA.
Support levels - 0.9077 (200W SMA), 0.9061 (61.8% Fib), 0.9039 (5-DMA)
Resistance levels - 0.9227 (June 2018 high), 0.9262 (78.6% Fib)
For details on FxWirePro's Currency Strength Index, visit http://www.fxwirepro.com/currencyindex.


