


 Indonesia Surprises Markets with Interest Rate Cut Amid Currency Pressure
  China’s Growth Faces Structural Challenges Amid Doubts Over Data
  Gold Prices Slide as Rate Cut Prospects Diminish; Copper Gains on China Stimulus Hopes
  European Stocks Rally on Chinese Growth and Mining Merger Speculation
  U.S. Banks Report Strong Q4 Profits Amid Investment Banking Surge
  US Gas Market Poised for Supercycle: Bernstein Analysts
  U.S. Stocks vs. Bonds: Are Diverging Valuations Signaling a Shift?
  Mexico's Undervalued Equity Market Offers Long-Term Investment Potential


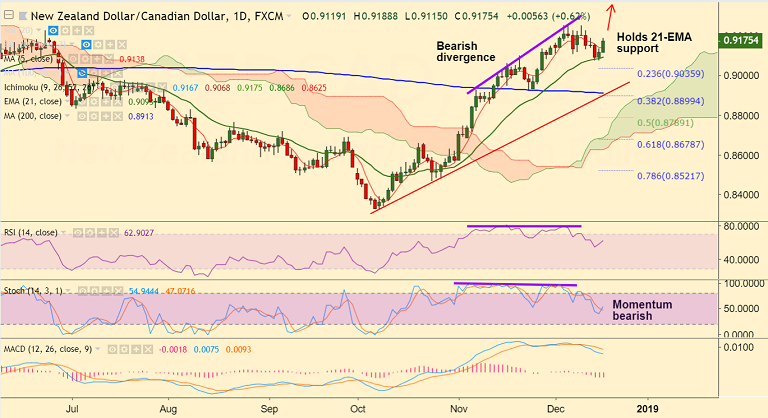
NZD/CAD chart on Trading View used for analysis
FxWirePro Currency Strength Index for NZD/CAD: Bias Bullish
FxWirePro's Hourly NZD Spot Index was at 100.667 (Bullish)
FxWirePro's Hourly CAD Spot Index was at -94.7994 (Bearish)
Technical Analysis: Bias Bullish
- Bounces off 21-EMA support, extends gains for the 2nd straight session
- Price action above cloud and major moving averages
- Breaks above 5-DMA at 0.9139
- Breaks above 1H 200 SMA, intraday charts are biased higher
Fundamental Factors:
- New Zealand Q3 GDP figures (due Wed) will drive price action if there is any significant surprise. Markets expect Q3 GDP to edge lower to 0.6% from 1.0% in the previous quarter.
- Focus also on Bank of Canada's (BoC) Consumer Price Index due Wednesday for further direction.
Support levels - 0.9139 (5-DMA), 0.9093 (21-EMA), 0.8982 (May 2 low)
Resistance levels - 0.9227 (Jun 22 high), 0.9251 (Dec 5, 11 high), 0.9275 (Apr 18 high)
Recommendation: Good to go long on dips around 0.9170, SL: 0.9135, TP: 0.92/ 0.9225/ 0.9250
For more details on FxWirePro's Currency Strength Index, visit http://www.fxwirepro.com/currencyindex.

- News

- Economy

- Central Banks
- Investing
- Research
- Roundups
- Digital Currency
- Insights
- Technical Analysis
- Technology
- Business
- Law
- Health
- Nature
- Fintech
- Science
- Topic
- Opinions
- ©Econometrics LLC . All Rights Reserved.
FxWirePro: NZD/CAD Trade Idea
Tuesday, December 18, 2018 4:20 AM UTC
Editor's Picks


- Market Data
Most Popular


