


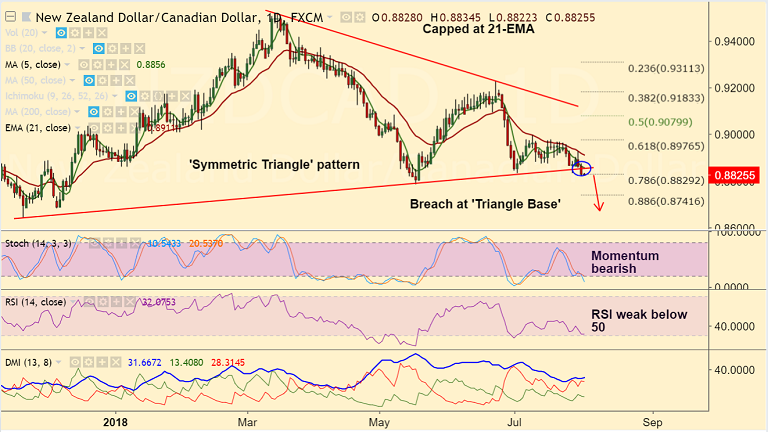
- NZD/CAD has shown a decisive breakout of 'Symmetric Triangle' pattern raising scope for further weakness.
- The pair is consolidating previous session losses, is trading in a narrow range with a day's high at 0.8834 and low at 0.8822.
- Oil grinding lower on the day after EIA reported the US crude oil inventories went up by 3.803 million barrels during the week.
- Falling oil prices could dent the commodity-linked Loonie, limiting downside in the pair.
- Technical indicators support weakness in the pair. Momentum is with the bears. Price action is below cloud and major moving averages.
- We see scope for test of 88.6% Fib at 0.8741. Any bearish invalidation only above 21-EMA.
Support levels - 0.8829 (78.6% Fib), 0.8786 (May 17 low), 0.8741 (88.6% Fib)
Resistance levels - 0.8856 (5-DMA), 0.89, 0.8911 (21-EMA)
Call update: Our previous call (https://www.econotimes.com/FxWirePro-NZD-CAD-hovers-at-Triangle-Base-decisive-break-below-to-see-dip-till-886-Fib-at-08741-1410649) has hit TP1.
Recommendation: Bias lower, stay short for further downside.
FxWirePro Currency Strength Index: FxWirePro's Hourly NZD Spot Index was at -136.489 (Bearish), while Hourly CAD Spot Index was at 102.617 (Bullish) at 0330 GMT. For more details on FxWirePro's Currency Strength Index, visit http://www.fxwirepro.com/currencyindex.


