


Amid the intermediate uptrend, gold prices have almost retraced up to 61.8% from the lows of 1046.54 to the recent highs of 1244.71 levels in the consolidation phase, currently struggling at 1233.31 levels.
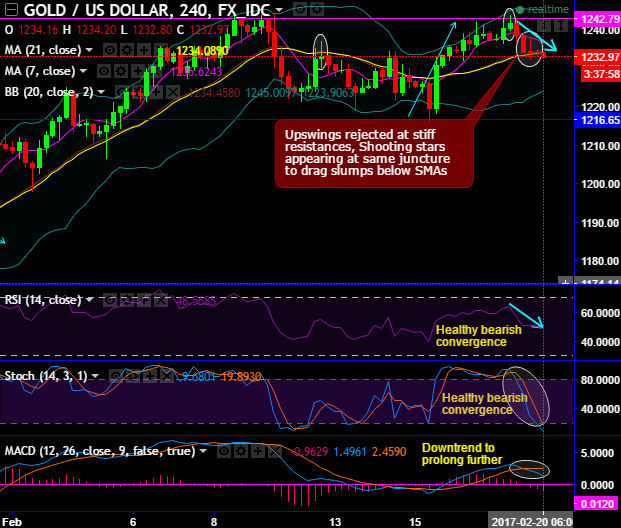
On 4H charts, the upswings rejected at stiff resistances, as a result, shooting stars appearing at same juncture (1241) to drag slumps below SMAs.
Please observe bearish patterns such as shooting star at the resistance of 1242.79 and at 21SMA levels.
Both leading and lagging oscillators are conformity to the selling pressures.
RSI and stochastic curves are converging to the price slumps to indicate the strong selling momentum.
While current prices on this timeframe sliding below 7SMAs, MACD on the other hand also evidences bearish crossover.
On the monthly chart, a doji pattern candle occurred at 1234.16 levels, as a result, bull swings are struggling for momentum at 61.8% fib levels. But on the contrary, given a continued prolonged upswings, you could foresee bullish EMA crossover. Subsequently, nine months consolidation phase likely to gain strength in the upcoming futures.
But wait for a decisive breach of 1251 and better clarity from the lagging indicators to establish long-term buying strategies.
Fundamentally, Federal Reserve’s rate hiking standpoint cannot be disregarded, which could hamper the bullish outlook of this precious metal.
For an intraday speculation, we advocate buying tunnel spreads with upper strikes at 1236.6314 and lower strikes at 1227 levels.
While on hedging grounds, at spot reference: 1232.97 we advocate initiating longs in Apr’17 CME gold futures. Trade target is $1250 and $1,285/oz with a stop loss at $1,216/oz.


