


 FxWirePro- Major Crypto levels and bias summary
  FxWirePro- Major Crypto levels and bias summary
  BTCUSD Coils in Tight Range: Will Geopolitical Stability Trigger a Breakout Toward $80,000?
  Bitcoin Retreats as Geopolitical Tensions Flare: BTC/USD Dips Following Iran’s Rejection of Ceasefire
  Ethereum’s $2,200 Ceiling: Can Diplomatic Breakthroughs Dissolve the Bearish Resistance?
  FxWirePro- Major Crypto levels and bias summary
  Ethereum Steady Above USD 2,000: ETH Tracks Bitcoin’s Lead as Bulls Eye a USD 2,770 Breakout


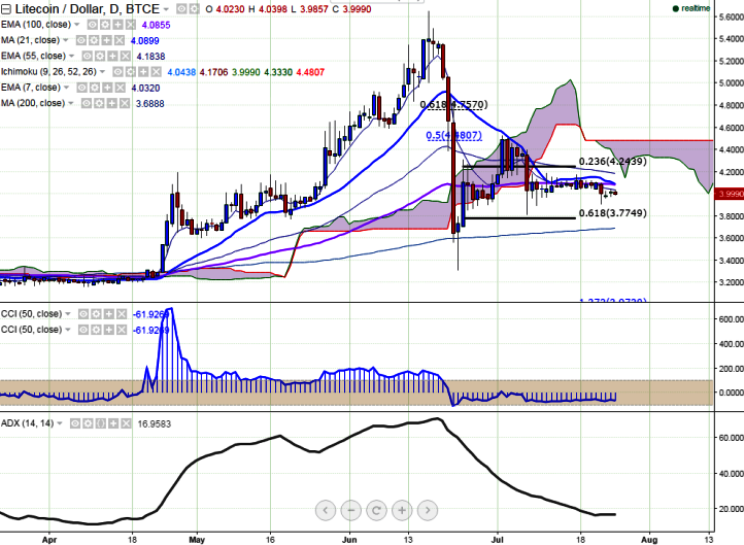
LTC/USD is seen trading below in red on Monday. The pair is trading in a narrow range between of $4.120 and $3.90 levels (BTCE) for the past three trading session. It is currently trading around $3.99 at the time of writing.
Ichimoku analysis of daily chart shows:
Tenkan-Sen $4.040
Kijun-Sen $4.17
Trend reversal - $4.087
The long-term and short-term trend remains to be bullish. In a daily chart, the pair is struggling to close below $4. Any break further weakness only below that level.
Major resistance is seen at $4.040 (7 days EMA) and any break above will take the pair till $4.11 (21 days MA)/$4.19 (55 days EMA). Major support can be noticed at $3.90 (Jul 22nd low) and break below will drag the pair till $3.77 (61.8% retracement of $3.310 and $4.490) $3.68 (200 day MA).

- News

- Economy

- Central Banks
- Investing
- Research
- Roundups
- Digital Currency
- Insights
- Technical Analysis
- Technology
- Business
- Law
- Health
- Nature
- Fintech
- Science
- Topic
- Opinions
- ©Econometrics LLC . All Rights Reserved.
FxWirePro: LTC/USD trades flat, good to buy the dips
Monday, July 25, 2016 12:32 PM UTC
Editor's Picks


- Market Data
Most Popular


