


 FxWirePro- Major Crypto levels and bias summary
  Ethereum’s $2,200 Ceiling: Can Diplomatic Breakthroughs Dissolve the Bearish Resistance?
  FxWirePro- Major Crypto levels and bias summary
  FxWirePro- Major Crypto levels and bias summary
  Bitcoin Retreats as Geopolitical Tensions Flare: BTC/USD Dips Following Iran’s Rejection of Ceasefire
  Ethereum Retreats in Bitcoin’s Shadow: ETH/USD Tests Critical Support at USD 2,075


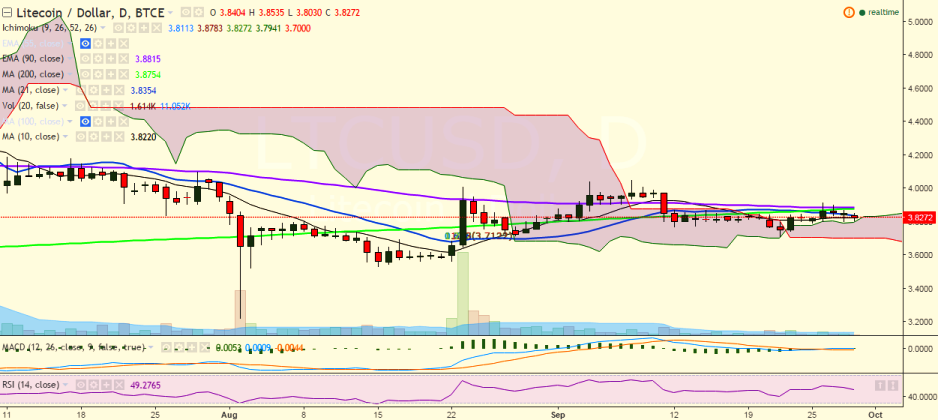
LTC/USD continues to trade below 200-day MA and has hit 3.80 levels before restoring slightly above to 3.85 levels, where it currently trades (BTC-e).
Short-term trend: Bearish
Ichimoku analysis of daily chart:
Tenkan Sen: 3.81
Kijun Sen: 3.87
Trend reversal: 3.88 (90 EMA)
On the upside, the pair faces strong resistance at 3.87 levels (200-day MA) and a consistent break above would see the pair testing 3.91 levels (September 26 high)/ 4.05 (September 8 high).
On the reverse side, support is likely to be found at 3.70 levels (September 22 low) and a break below would weaken it to 3.50 (psychological level)/ 3.22 (August 02 low).

- News

- Economy

- Central Banks
- Investing
- Research
- Roundups
- Digital Currency
- Insights
- Technical Analysis
- Technology
- Business
- Law
- Health
- Nature
- Fintech
- Science
- Topic
- Opinions
- ©Econometrics LLC . All Rights Reserved.
FxWirePro: LTC/USD struggles to close above 200-DMA, good to sell on rallies
Thursday, September 29, 2016 11:22 AM UTC
Editor's Picks


- Market Data
Most Popular


