


 BTCUSD Coils in Tight Range: Will Geopolitical Stability Trigger a Breakout Toward $80,000?
  Bitcoin Retreats Toward Critical Support as Geopolitical Winds Shift
  FxWirePro- Major Crypto levels and bias summary


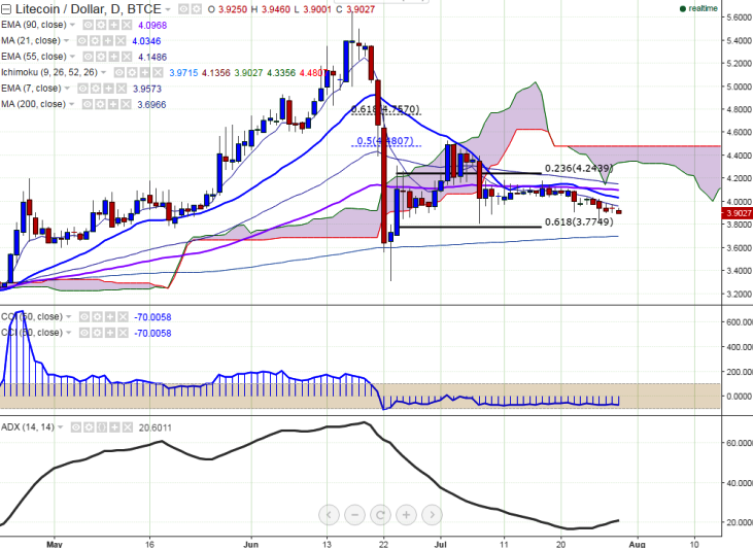
LTC/USD is seen plunging much below on Friday. The pair has slightly retreated after making a high of $3.98 levels (BTCE). It is currently trading around $3.902 at the time of writing.
Ichimoku analysis of daily chart shows:
Tenkan-Sen $3.979
Kijun-Sen $4.15
Trend reversal - $4.10
Long-term trend remains to be bullish and the short- term trend seems to be bearish. In a daily chart, the pair is struggling to close above 21 days MA. So slight bullishness can be seen only above that level.
Major resistance is seen at $3.975 (7 days EMA) and any break above will take the pair till $4.044 (21 days MA)/$4.157 (55 days EMA). Major support can be noticed at $3.83 (Jul 26th low) and break below will drag the pair till $3.68 (200 days MA)/$3.31 (200 day MA).

- News

- Economy

- Central Banks
- Investing
- Research
- Roundups
- Digital Currency
- Insights
- Technical Analysis
- Technology
- Business
- Law
- Health
- Nature
- Fintech
- Science
- Topic
- Opinions
- ©Econometrics LLC . All Rights Reserved.
FxWirePro: LTC/USD struggles to break above $4, good to sell on rallies
Friday, July 29, 2016 11:15 AM UTC
Editor's Picks


- Market Data
Most Popular


