


 Gold Prices Fall Amid Rate Jitters; Copper Steady as China Stimulus Eyed
  FxWirePro: Daily Commodity Tracker - 21st March, 2022


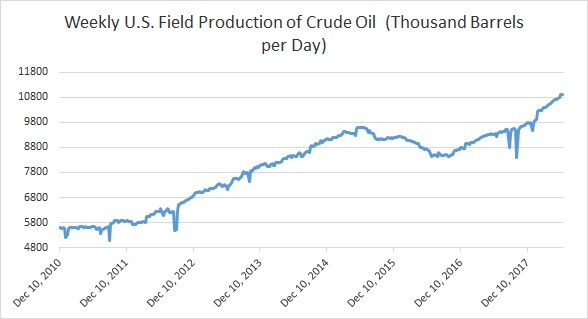
Here are some key charts based on data from United States’ Energy Information Agency’s (EIA) latest report that explains the level of inventories, refinery demand, and production.
- Chart 1 shows crude oil production in the United States which has reached new all-time high. It was last week at 10.9 million barrels per day same as last two weeks.
- Chart 2 shows the level of U.S. distillate inventories. It has been declining rapidly. According to the latest report, the inventory rose to 117.4 million barrels.
- U.S. oil imports have been declining over the past couple of year. However, Chart 3 shows that imports rose last week to 8.36 million barrels per day.
- Chart 4 shows the level of U.S. crude oil exports, which rose last week to reach a record high of 3 million barrels per day.
- Chart 5 shows U.S. refinery operating at 97.5 percent capacity, the highest level in more than a decade.
- Chart 6 shows the level of crude oil inventories, which has declined by 117.3 million barrels since its peak in April 2017. Inventories have declined last week to 416.6 million barrels.


