


 Elon Musk’s Empire: SpaceX, Tesla, and xAI Merger Talks Spark Investor Debate
  JPMorgan Lifts Gold Price Forecast to $6,300 by End-2026 on Strong Central Bank and Investor Demand
  FxWirePro- Major Crypto levels and bias summary


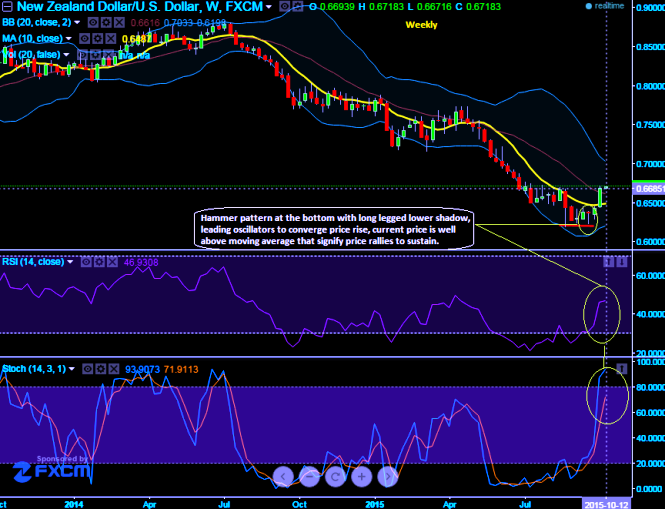
Kiwi dollar after continues losing streak that has begun from mid April, it is now making an attempt of recovery a bit as both RSI and stochastic oscillators signaling buying sentiments even though it reached in overbought zones.
Leading indicators on weekly charts suggest prevailing price recoveries to sustain further and may even show further strength in near future. RSI on weekly is beautifully converging to the price bounces right from below 30 levels, while %D crossover of slow stochastic curve below 20 levels which is oversold territory also suggest buying pressure are strengthened. To substantiate this bullish view we also spotted out a hammer pattern on the bottom (at 0.6375 levels) which could be deemed as bullish reversal in medium run. Hammer at the bottom suggest bears have lost interest and bulls have aggressively snatched the price gains, as result long lower shadow is fromed from the lows of the week.
You can observe on the monthly charts also for the historical evidence as to how the pair has behaved whenever RSI and stochastic curves have simultaneously reached oversold zone.
However, we cannot disregard bearish trend for the long term perspectives also as the pair has been tumbling non-stop from the peaks in last April at 0.7736 levels to evidence the huge losses on weekly charts. The pair currently held strong supports at 0.6450 levels from one and half months.
We predict Chinese slowdown may certainly impact adversely on NZD in long term future though short term gains are on the cards.

- News

- Economy

- Central Banks
- Investing
- Research
- Roundups
- Digital Currency
- Insights
- Technical Analysis
- Technology
- Business
- Law
- Health
- Nature
- Fintech
- Science
- Topic
- Opinions
- ©Econometrics LLC . All Rights Reserved.
FxWirePro: Hammer pattern on Kiwi dollar - likely to extend gains against USD
Monday, October 12, 2015 7:04 AM UTC
Editor's Picks


- Market Data
Most Popular


