


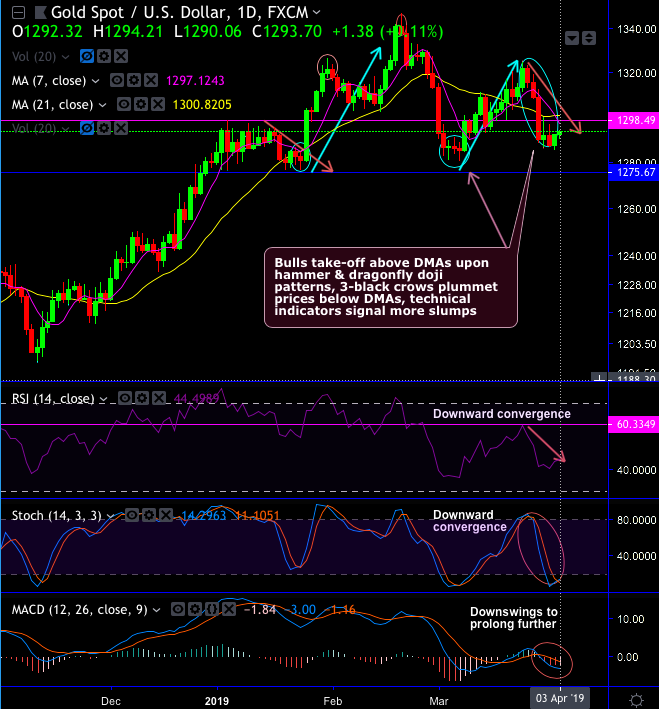
Gold’s (XAUUSD price) has plummeted below 7 & 21-DMAs after 3-black crow pattern at $1,290.14 levels. Failure swings were observed at peaks of $1,346.61 levels.
However, buying sentiments are still visible after dragonfly doji and hammer formations at $1,287.09 and $1,285.39 levels (refer daily chart). There is no support from technical indicators as you could observe both RSI & stochastic curves show downward convergence constantly to the steep price dips to indicate selling momentum.
To substantiate this bearish sentiment, the trend indicators also show bearish DMA & MACD crossovers on this timeframe.
On a broader perspective, double top with consecutive shooting stars nudges price below EMAs on monthly plotting.
Recently, shootings star pops-up again at $1,326.63 level that puzzles the major trend. While both momentum oscillators (RSI &Stochastic curves) substantiate bearish sentiment with overbought pressures at this juncture, It could form a triple top, if bears manage to drag slumps.
Overall, bulls in the bullion market managed to ensure the consolidation phase, while bears never gave up major downtrend and it is likely to prolong as long as the current price remains below the stiff resistance of $1,368.20 levels.
Trading tips: At spot reference: $1,293.57 levels, on trading grounds, one can trade this commodity via boundary options spreads using upper strikes at 1,300.80 and lower strikes at 1,285.62 levels. The strategy is likely to fetch exponential yields as the underlying commodity price remains between these strikes on the expiration.
Currency Strength Index: FxWirePro's hourly EUR is at 16 (mildly bullish), the hourly USD spot index is inching towards 5 levels (neutral) while articulating at 11:41 GMT.
For more details on the index, please refer below weblink: http://www.fxwirepro.com/currencyindex


