


 Best Gold Stocks to Buy Now: AABB, GOLD, GDX


The yellow metal closed the month of May only marginally higher but it recorded the longest monthly increase since 2010. The precious metal advanced just 0.05 percent for the month of May, closing it tat $1268.92 per troy ounce but it helped the yellow metal to register an increase of 10.6 percent for the year so far.
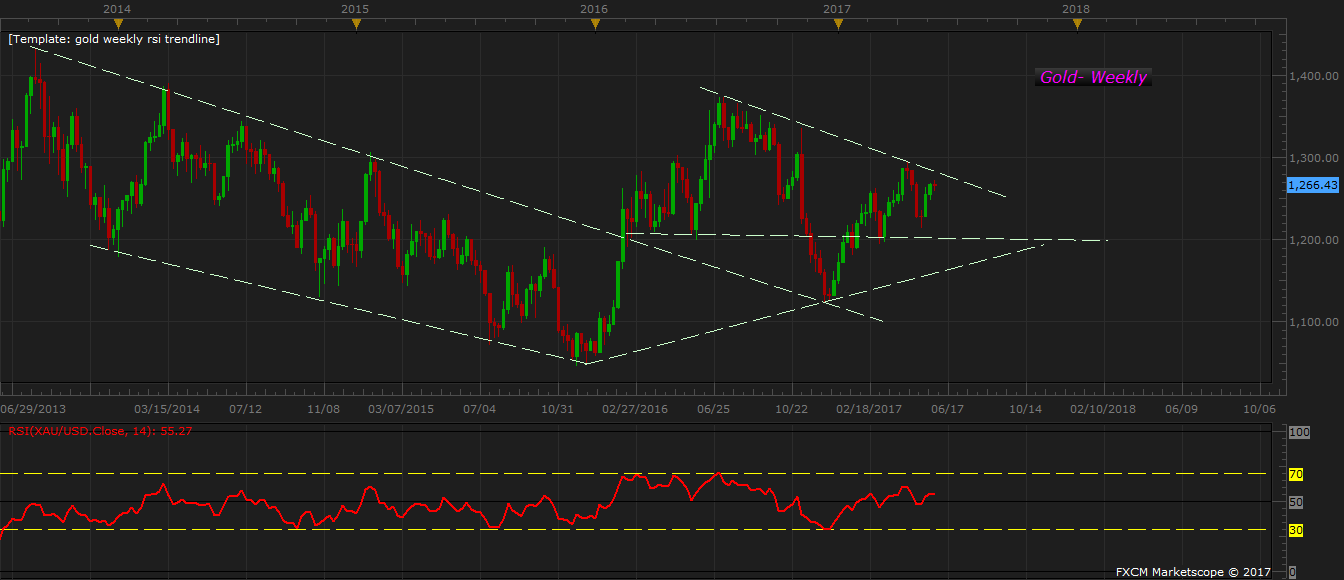
Yesterday, in an article we discussed the outlook for gold, which according to us at FxWirePro would trade within a narrowing range of an upward sloping bullish line and a downward sloping bearish line unless the breakout happens around the end of the year, sometime in November or December. Here are some portions from the article,
“A big breakout for the yellow metal looms ahead and until that happens, we suspect that the gold price would continue to consolidate within the range defined the by the upward bullish trend line and the downward bearish trend line. See chart for reference. The chart above shows the weekly chart of gold. The gold price was able to break above the downside trend channel that began back in 2013, last year after price bottomed around $1050 per troy ounce area.
Last year, the yellow metal had quite a run in the first half. It rose from around $1060 per troy ounce in January 2016 to $1370 per troy ounce in July 2016. After which the performance waned and the gold price declined $1130 per troy ounce area by December that year. While the price is up since the Gold has failed to break the resistance line that has dogged it since last year. It is still struggling to break above.”
We are expecting the gold price to rise to as high as $1365 per troy ounce.


