


 Best Gold Stocks to Buy Now: AABB, GOLD, GDX
  FxWirePro: Daily Commodity Tracker - 21st March, 2022


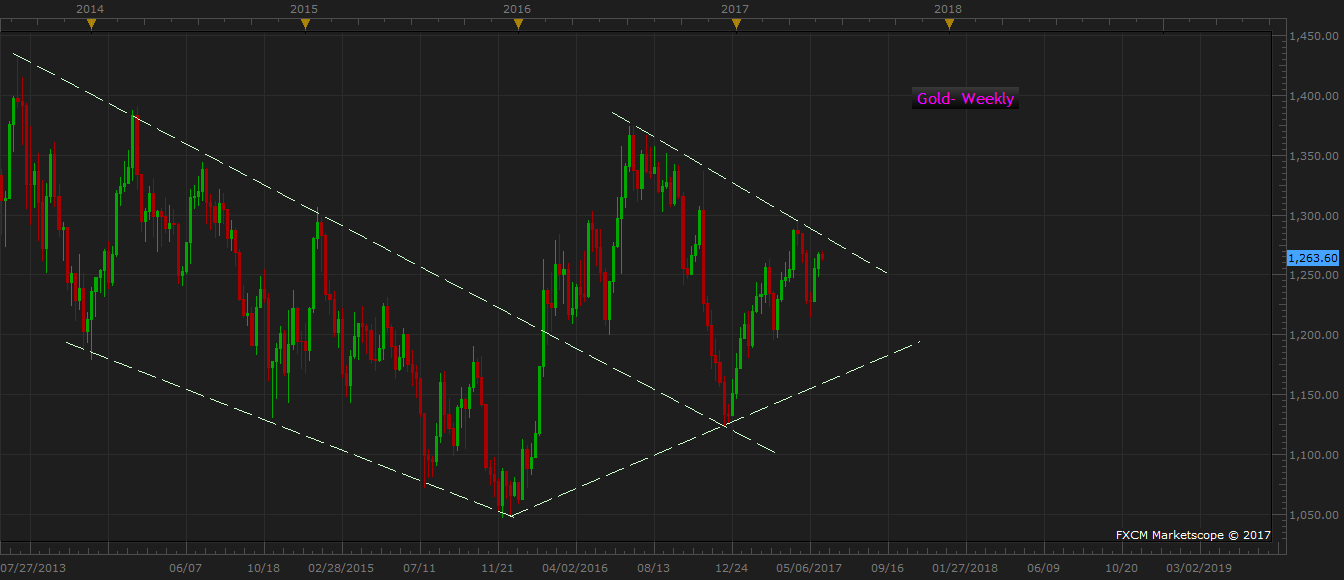
A big breakout for the yellow metal looms ahead and until that happens, we suspect that the gold price would continue to consolidate within the range defined the by the upward bullish trend line and the downward bearish trend line. See chart for reference. The chart above shows the weekly chart of gold. The gold price was able to break above the downside trend channel that began back in 2013, last year after price bottomed around $1050 per troy ounce area.
Last year, the yellow metal had quite a run in the first half. It rose from around $1060 per troy ounce in January 2016 to $1370 per troy ounce in July 2016. After which the performance waned and the gold price declined $1130 per troy ounce area by December that year. While the price is up since Gold has failed to break the resistance line that has dogged it since last year. It is still struggling to break above.
The gold price is currently trading at $1263 per troy ounce and we suspect that the price could decline further to test the rising trend line which provided support to gold at $1130 area last December and would continue to trade within the range until the end of the year, when we suspect a breakout to take place.
We remain committed to our previously stated upside targets around $1365 per troy ounce area.


