


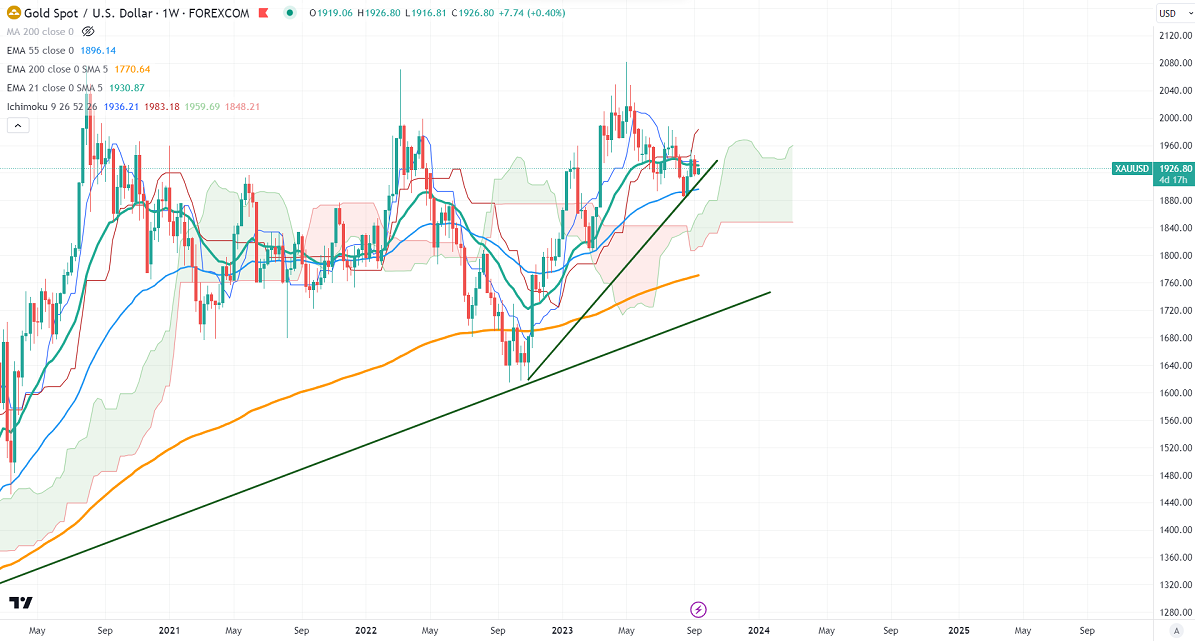
Ichimoku Analysis (Weekly chart)
Tenken-Sen- $1936.21
Kijun-Sen- $1975.84
Gold pared some of its gains on strong US treasury yields. It hit a low of $1915.30 and is currently trading around $1923.54.
The number of people who have filed for unemployment benefits has dropped by 13000 to 216000 in the week ended Sep 2, compared to a forecast of 232000.US ISM services PMI rose to 54.50 in August, compared to a forecast of 52.50.
Major economic data for the week
Sep 13, 2023, US CPI m/m (12:30 pm GMT)
Sep 14, 2023, ECB Main Refinancing rate (12:15 pm GMT)
Core PPI m/m (12:30 pm GMT)
Core Retail sales
US Jobless claims
Sep 15, 2023, US Empire State Manufacturing Index (12:30 pm GMT)
Prelim UoM consumer sentiment
US dollar index- Bullish. Minor support around 103/102. The near-term resistance is 105/106.
According to the CME Fed watch tool, the probability of a no-rate hike in Sep decreased to 93% from 94% a week ago.
ON FRIDAY, the US 10-year yield showed a minor pullback of more than 2%. The US 10 and 2-year spread narrowed to -70% from -72 %.
Factors to watch for gold price action-
Global stock market- mixed (neutral for gold)
US dollar index - Bullish (negative for gold)
US10-year bond yield- Bullish (negative for gold)
Technical:
The near–term support is around $1915, a break below targets of $1900/$1880. The yellow metal faces minor resistance around $1930 and a breach above will take it to the next level of $1950/$1970/$2000.
It is good to sell on rallies around $1935-36 with SL around $1951 for TP of $1885.


