


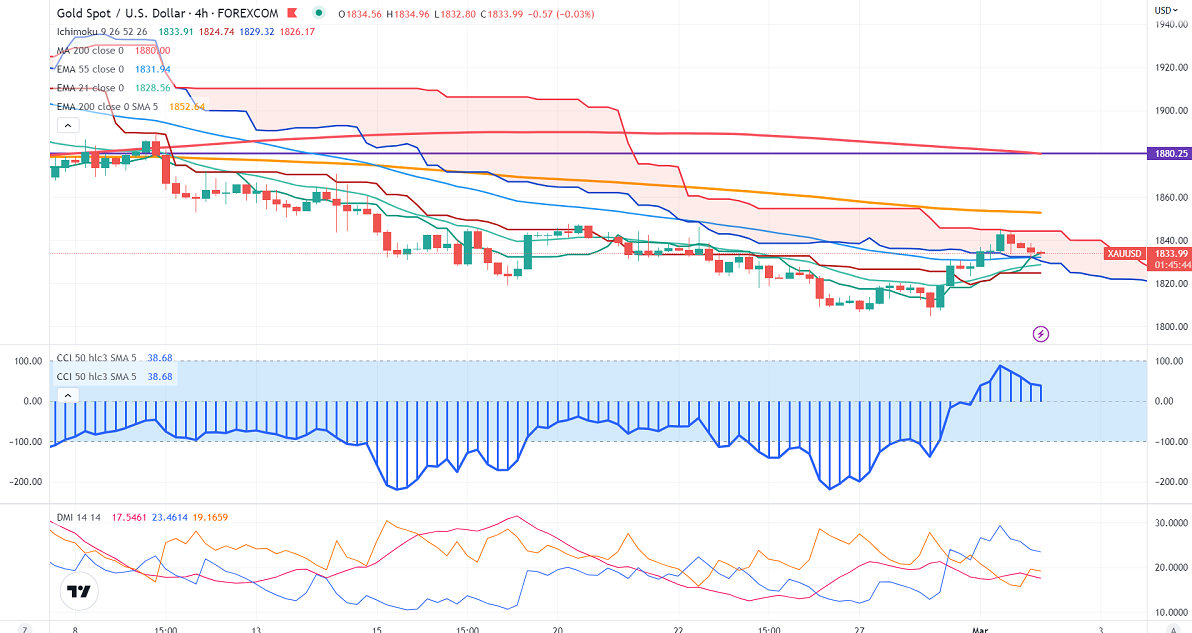
Ichimoku Analysis (4-hour chart)
Tenken-Sen- $1831.78
Kijun-Sen- $18247.74
Gold prices showed a profit booking due to a minor pullback in the US dollar. US dollar index and US treasury yield gained after US economic data yesterday. Gold hits a high of $1844 and is currently trading around $1834.50.
The US manufacturing PMI jumped to 47.70 last month from 47.4 in Jan, below the estimate of 48. While ISM manufacturing prices rose to 51 from a forecast of 45.
Major economic data for this week
US Initial jobless claims
US dollar index-Bullish. Minor support around 104.35/103.70. The near-term resistance is 105.35/106.
According to the CME Fed watch tool, the probability of a 50 bpbs rate hike in Mar increased to 30% from 24% a week ago.
The US 10-year yield surged sharply and holds above 4%, the highest level since Nov. The US 10 and 2-year spread widened to -89 basis points from -77% bpbs.
Factors to watch for gold price action-
Global stock market- bearish (Positive for gold)
US dollar index - Bullish (Negative for gold)
US10-year bond yield- Bullish (negative for gold)
Technical:
The near–term support is around $1820, a break below targets of $1800/ $1788/$1748. The yellow metal faces minor resistance around $1847, and a breach above will take it to the next level of $1860/$1888/$1900.
It is good to sell on rallies around $1845-46 with SL around $1860 for TP of $1800.


