


Gold chart - Trading View
- Gold edged lower on Monday's trade amid improved risk sentiment after fresh US-China trade talks.
- However, price failed to break below 5-DMA support. 5-DMA is upward sloping and is offering strong support.
- The pair is trading in the green in the European session despite signs of risk reset. Weakness in the US dollar likely supporting price.
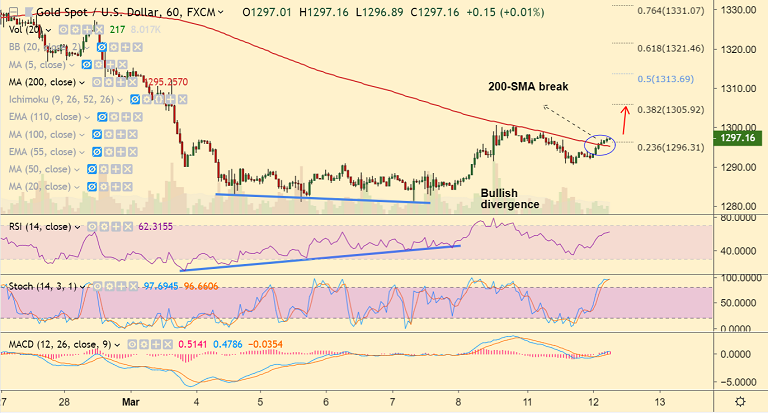
- Technical indicators on the hourly charts have turned bullish. Price has broken above 1H 200 SMA and we see a bullish divergence which adds to upside bias.
- Focus on U.S. CPI data for further impetus. Gold price could test $1,300 if the US CPI misses estimates.
- CPI is likely to remain unchanged at 1.6% y/y. Core CPI is expected to remain unchanged at 0.2% and 2.2% m/m and y/y respectively.
Support levels - 1295.25 (1H 200-SMA), 1291.83 (5-DMA), 1280.57 (Mar 7 low)
Resistance levels - 1300, 1305.92 (38.2% Fib), 1307.19 (5W SMA)
Recommendation: Good to go long on dips around 1296, SL: 1290, TP: 1300/ 1305/ 1307
For details on FxWirePro's Currency Strength Index, visit http://www.fxwirepro.com/currencyindex.


