


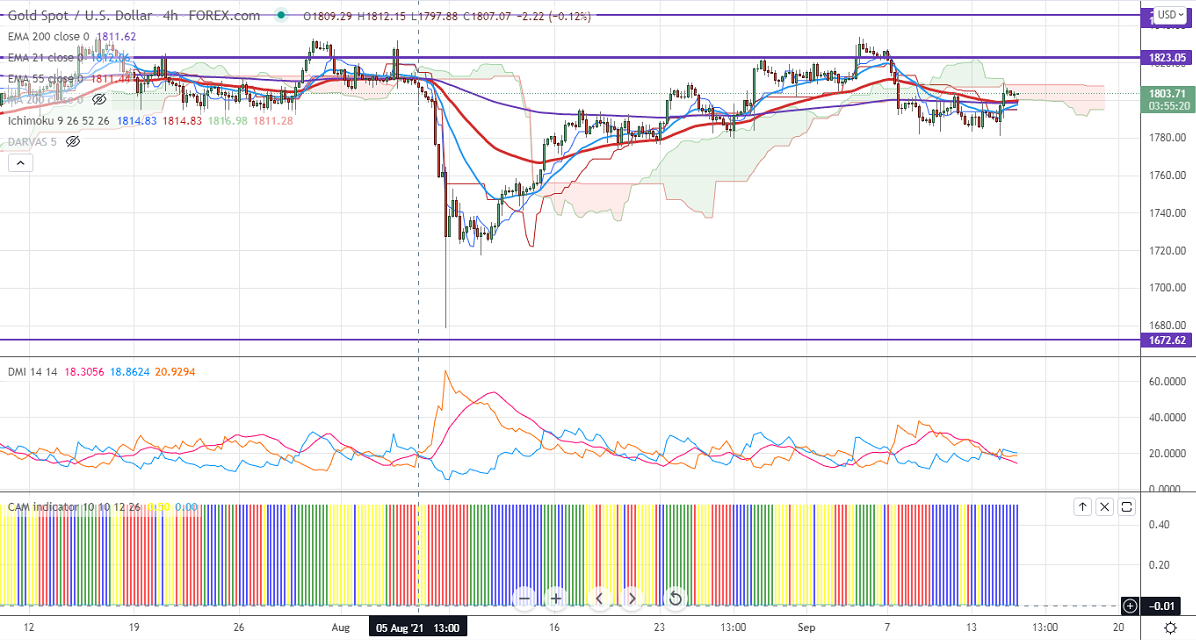
Ichimoku analysis (4-hour chart)
Tenken-Sen- $1794.97
Kijun-Sen- $1794.97
Previous week High- $1830.33
Previous week low- $1782
Gold jumped above the $1800 level after US CPI data. It rose by 0.3% in August compared to a forecast of 0.4%. The headline inflation for the year jumped to 5.3%, in with expectations. The US dollar index has shown selling pressure after the weak inflation data. The sell-off in US treasury yields also preventing the yellow metal from further weakness. The yellow metal hits a high of $1808 and is currently trading around $1803.50.
Economic data-
Markets eye US empire state manufacturing index, industrial production for further direction.
Factors to watch for gold price action-
Global stock market- Bullish (negative for gold)
US dollar index – Bearish (Positive for gold)
US10-year bond yield- Bearish (Positive for gold)
Technical:
The immediate resistance is around $1810 and a convincing break above will take the yellow metal $1821/$1835/$1850/$1860/$1877/$1900 is possible. It is facing strong support at $1770, violation below targets $1750/$1725.
It is good to sell on rallies around $1818-20 with SL around $1835 for TP of $1750.


