


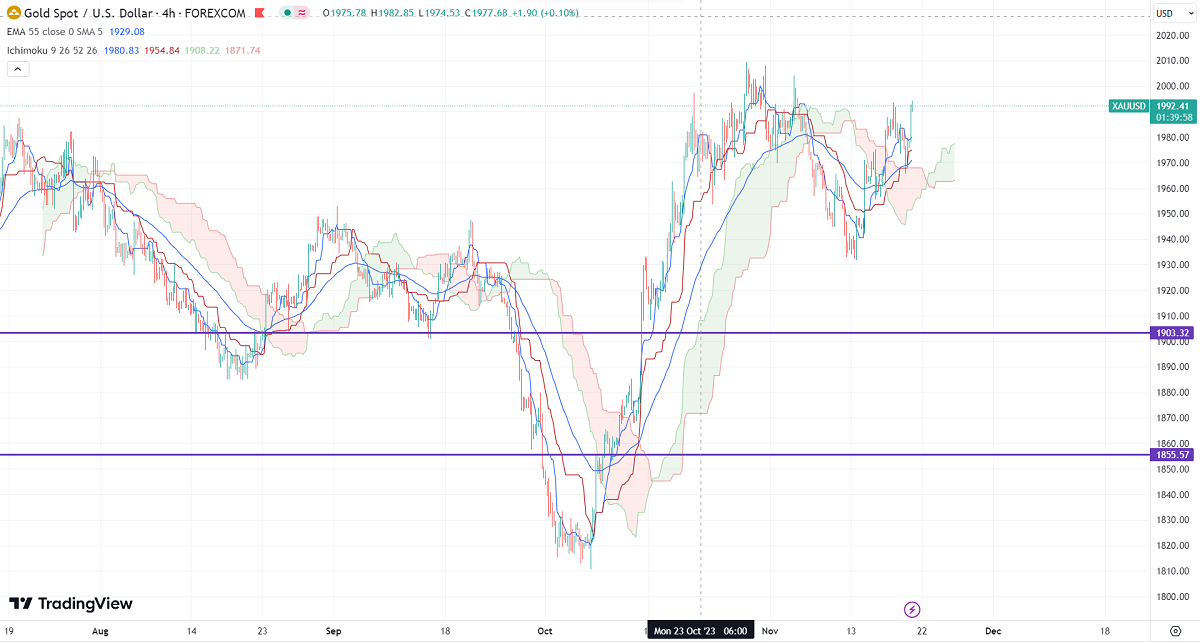
Ichimoku Analysis (4 hour chart)
Tenken-Sen- $1979.16
Kijun-Sen- $1974.46
Gold showed a nice pullback on board-based US dollar weakness. It hit a high of $1994.50 and is currently trading around $1991.98.
Major Economic Data for the week
Nov 21st, 2023, US Existing home sales (3 pm GMT)
FOMC Meeting minutes (7 pm GMT)
US dollar index- Bearish. Minor support around 103/102. The near-term resistance is 104/105.
According to the CME Fed watch tool, the probability of a no-rate hike increased to 99.9% from 85.50% a week ago.
The US 10-year yield lost its shine ahead of Fed meeting minutes. The US 10 and 2-year spread widened to -52% from -16%.
Factors to watch for gold price action-
Global stock market- Bullish (negative for gold)
US dollar index - Weak (positive for gold)
US10-year bond yield- Bearish (Positive for gold)
Technical:
The near–term support is around $1965, a break below targets of $1950/$1929/$1900/$1850. The yellow metal faces minor resistance around $2000 and a breach above will take it to the next level of $2010/$2025.
It is good to buy on dips around $1975-76 with SL around $1965 for TP of $2000/$2009.


