


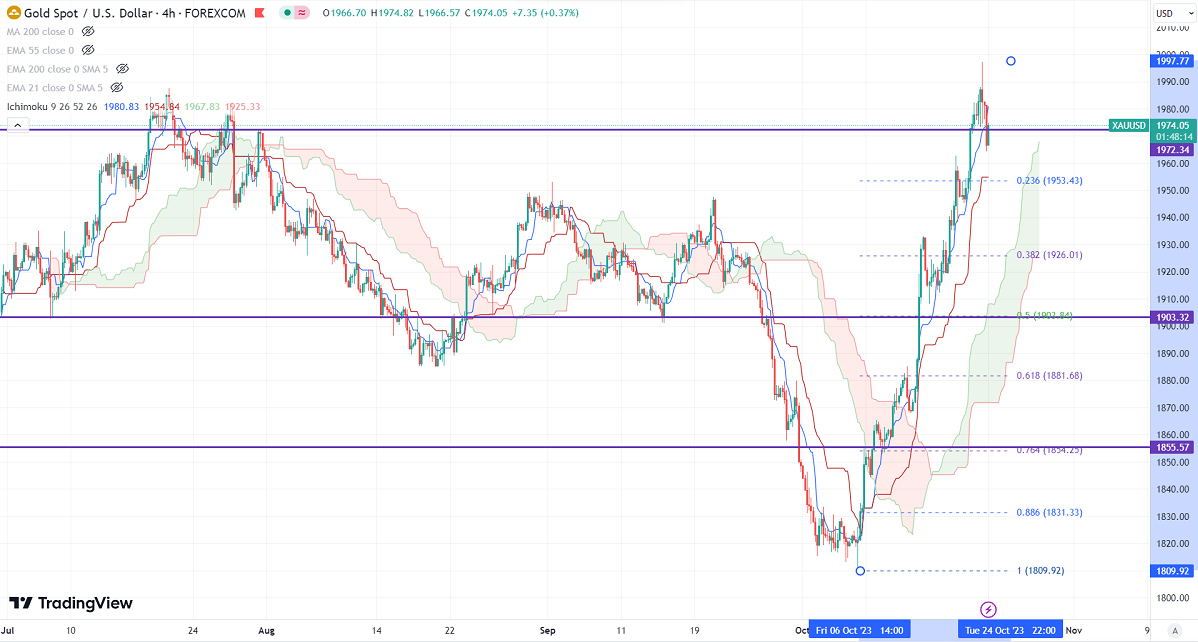
Ichimoku Analysis (4-hour chart)
Tenken-Sen- $1973.53
Kijun-Sen- $1954.84
Gold price hits multi-month high on geopolitical tension. It hit a high of $1997 yesterday and is currently trading at around $1974.09.
The escalation of war between Hamas and Israel has increased the demand for safe-haven assets like Gold. The jump in US treasury yield prevented the yellow metal from further upside.
The number of people who have filed for unemployment benefits declined by 13000 to 198000 for the period ended Oct 14th, below the estimate of 210000. The US Empire State manufacturing index declines to -4.6, compared to a forecast of -7.US retail sales surged sharply in Sep to 0.70%, above the estimate of 0.30%. Core retail sales excluding automobiles, gasoline, and building materials rose 0.60% vs. a Forecast of 0.20%.
Major Economic data for the week
Oct 24th, 2023, USD Flash manufacturing PMI (1:45 pm GMT)
Richmond Manufacturing Index (2:00 pm GMT)
Oct 25th, 2023, BOC rate statement (2 pm GMT)
Fed Chairman Powell's speech (8:35 pm GMT)
Oct 26th 2023, US Advance GDP q/q (12:30pm GMT)
Core Durable goods orders m/m (12:30 pm GMT)
ECB press conference (12:45 pm GMT)
Oct 27 2023, Core PCE price index m/m (12:30 pm GMT)
Revised UoM consumer sentiment (2:00 pm GMT)
US dollar index- Bullish. Minor support around 105.80/105. The near-term resistance is 107.50/109.
According to the CME Fed watch tool, the probability of a no-rate hike in Nov increased to 98.50% from 93.80% a week ago.
The US 10-year yield surged past 5% for the first time since July 20th, 2007 in hopes of a further rate hike. The US 10 and 2-year spread narrowed to -15% from -75%.
Factors to watch for gold price action-
Global stock market- Bearish (positive for gold)
US dollar index - mixed (neutral for gold)
US10-year bond yield- Bullish (Negative for gold)
Technical:
The near–term support is around $1960, a break below targets of $1950/$1926. The yellow metal faces minor resistance around $2000 and a breach above will take it to the next level of $2020/$2048.
It is good to buy on dips around $1960 with SL around $1948 for TP of $2000/$2020.


