


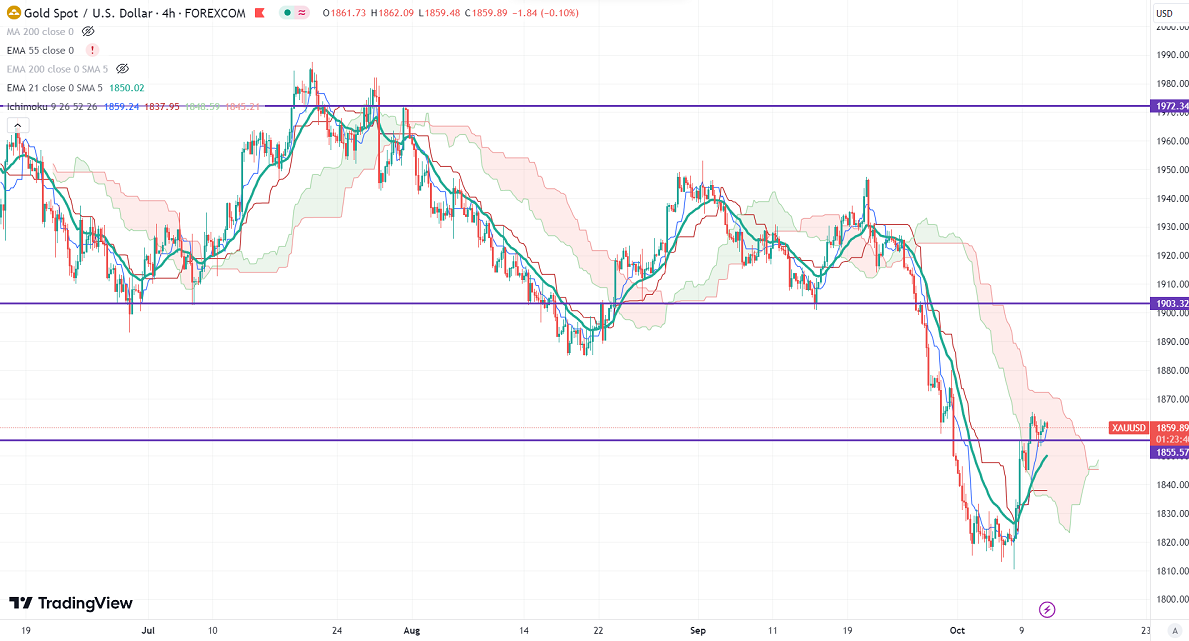
Ichimoku Analysis (4-hour chart)
Tenken-Sen- $1855.26
Kijun-Sen- $1837.90
Gold trades flat after a major pullback of more than $50. It hit a high of $1865.39 and is currently trading at around $1860.47.
Hamas's attack on Israel has elevated Middle East geopolitical tension. Investors shifted their buying interest to safe-haven assets like gold after the Israel and Gaza war.
Major economic data for the week
Oct 11th, 2023, US PPI (12:30 pm GMT)
US dollar index- Neutral. Minor support around 105.80/105. The near-term resistance is 106.50/107.50.
According to the CME Fed watch tool, the probability of a no-rate hike in Nov increased to 84.30% from 71.80% a week ago.
The US 10-year yield trades in a narrow ranger ahead of the US PPI. The US 10 and 2-year spread narrowed to -35.6% from -75%.
Factors to watch for gold price action-
Global stock market- Bearish (positive for gold)
US dollar index - Mixed (neutral for gold)
US10-year bond yield- Mixed (neutral for gold)
Technical:
The near–term support is around $1830, a break below targets of $1800/$1785/$1760. The yellow metal faces minor resistance around $1870 and a breach above will take it to the next level of $1885/$1900.
It is good to buy on dips around $1850-51 with SL around $1830 for TP of $1900.


