


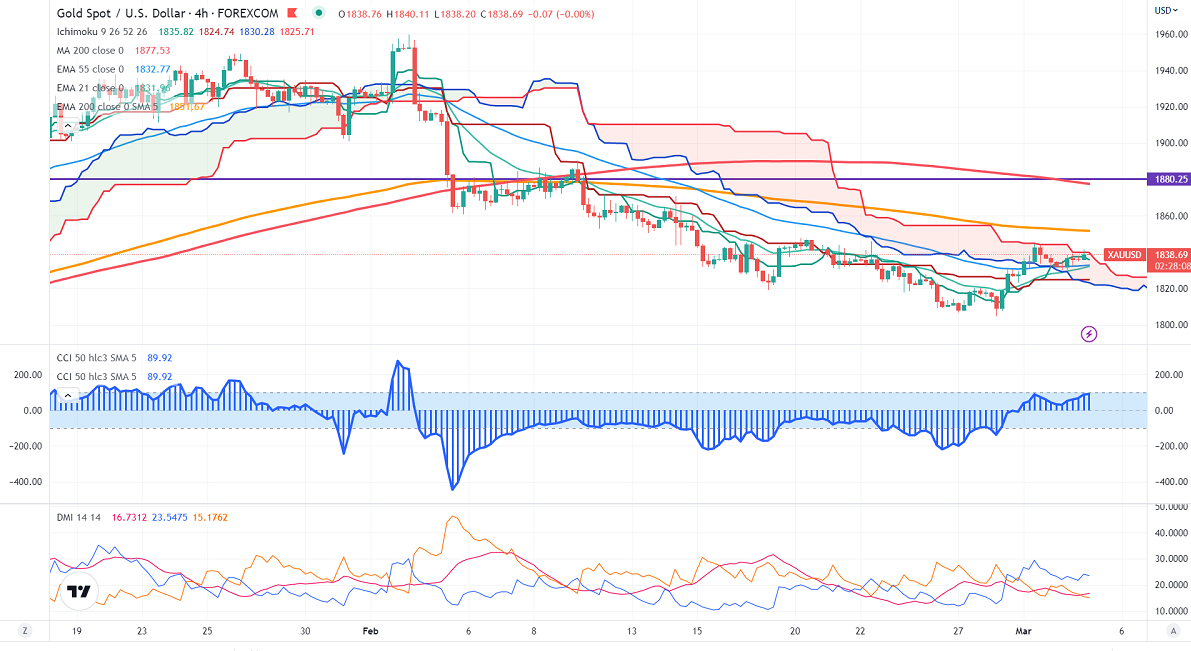
Ichimoku Analysis (4-hour chart)
Tenken-Sen- $1837.39
Kijun-Sen- $1824.74
Gold prices trades in a narrow range between $1844 and $1830 for the past two days. The surge in US 10-year yields put pressure on the yellow metal at higher levels. Gold hits a high of $1841.50 and is currently trading around $1839.17.
The number of people who have filed for unemployment benefits fell by 2000 to 190000 the previous week, compared to a forecast of 195000.
Major economic data today
US services PMI
US dollar index-Bullish. Minor support around 104.35/103.70. The near-term resistance is 105.35/106.
According to the CME Fed watch tool, the probability of a 50 bpbs rate hike in Mar decreased to 29.90% from 27% a week ago.
The US 10-year yield holds above 4%, the highest level since Nov in hopes of an aggressive rate hike by the Fed. The US 10 and 2-year spread widened to -83.8 basis points from -77% bpbs.
Factors to watch for gold price action-
Global stock market- bearish (Positive for gold)
US dollar index - Bullish (Negative for gold)
US10-year bond yield- Bullish (negative for gold)
Technical:
The near–term support is around $1820, a break below targets of $1800/ $1788/$1748. The yellow metal faces minor resistance around $1847, and a breach above will take it to the next level of $1860/$1888/$1900.
It is good to sell on rallies around $1845-46 with SL around $1860 for TP of $1800.


