


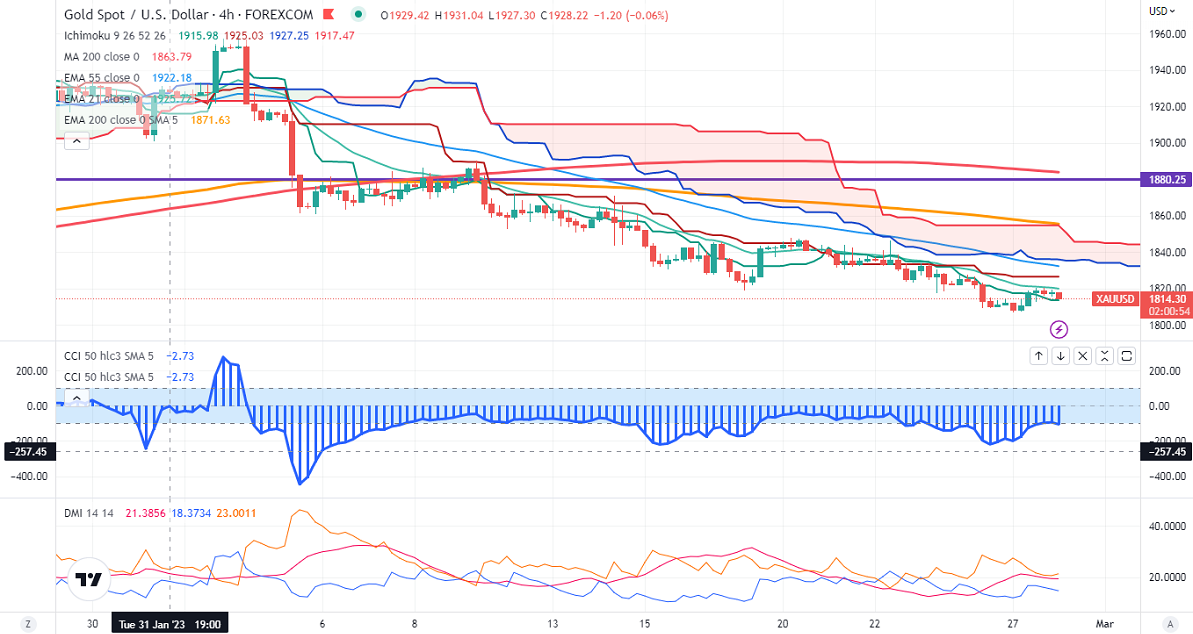
Ichimoku Analysis (4-hour chart)
Tenken-Sen- $1813.47
Kijun-Sen- $1826.43
Gold prices showed a minor pullback on short covering. The US dollar index declined below the 105 level after weak US durable goods orders. It hits an intraday low of $1814 and is currently trading around $1814.30.
US durable goods orders declined by 4.5% in Jan, slightly weaker than the market forecast of -4%. Core durable orders excluding transportation surged by 0.70% vs. an estimate of 0.10%. US pending home sales jumped 8.10% Feb, biggest increase since June 2020.
Major economic data for this week
Feb 28th US CB consumer confidence
US Richmond manufacturing Index
US dollar index-Bullish. Minor support around 104.35/103.70. The near-term resistance is 105.35/106.
According to the CME Fed watch tool, the probability of a 50 bpbs rate hike in Mar jumped to 25.50% from 18.1% a week ago.
The US 10-year yield trades flat after a minor pullback. The US 10 and 2-year spread widened to -86.9 basis points from -77% bpbs.
Factors to watch for gold price action-
Global stock market- bearish (Positive for gold)
US dollar index - Bullish (Neutral for gold)
US10-year bond yield- Bullish (negative for gold)
Technical:
The near–term support is around $1800, a break below targets of $1788/$1748. The yellow metal faces minor resistance around $1820, and a breach above will take it to the next level of $1840/$1857.
It is good to sell on rallies around $1825-26 with SL around $1855 for TP of $1780.


