


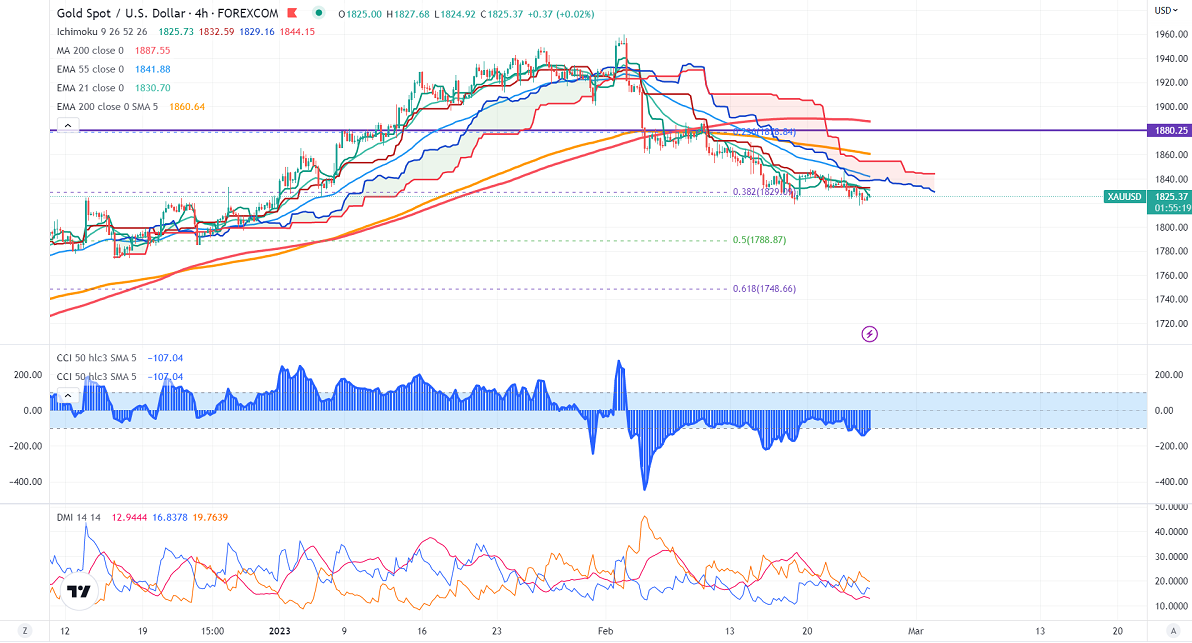
Ichimoku Analysis (4 hour chart)
Tenken-Sen- $1828.02
Kijun-Sen- $1832.59
Gold prices have shown a minor pullback as US GDP misses estimates. The economy expanded at an annual pace of 2.7%, slightly lower compared to an estimate of 2.9%. The report said that core inflation surged to 4.3% in the fourth quarter vs. the forecast of 3.9%. It hits an intraday high of $1825.71 and is currently trading around $1825.90.
The number of people who have filed for unemployment benefits dropped by 3000 to 192000 for the week ended 18 Feb, the lowest level in 3 weeks.
Major economic data:
US Core PCE index
New home sales
US dollar index-Bullish. Minor support around 102.50/101.50. The near-term resistance is 104.90/106.
According to the CME Fed watch tool, the probability of a 50 bpbs rate hike in Mar jumped to 28% from 15.1% a week ago.
The US 10-year yield pared most of its gains despite hawkish Fed meeting minutes. The US 10 and 2-year spread narrowed to -77 basis points from -88% bpbs.
Factors to watch for gold price action-
Global stock market- bearish (Positive for gold)
US dollar index - Mixed (Neutral for gold)
US10-year bond yield- Bullish (negative for gold)
Technical:
The near–term support is around $1816 (21-W EMA), a break below targets of $1800/$1788/$1748. The yellow metal faces minor resistance around $1850, and a breach above will take it to the next level of $1900/$1925/$1950.
It is good to sell on rallies around $1848-51 with SL around $1871 for TP of $1800.


