


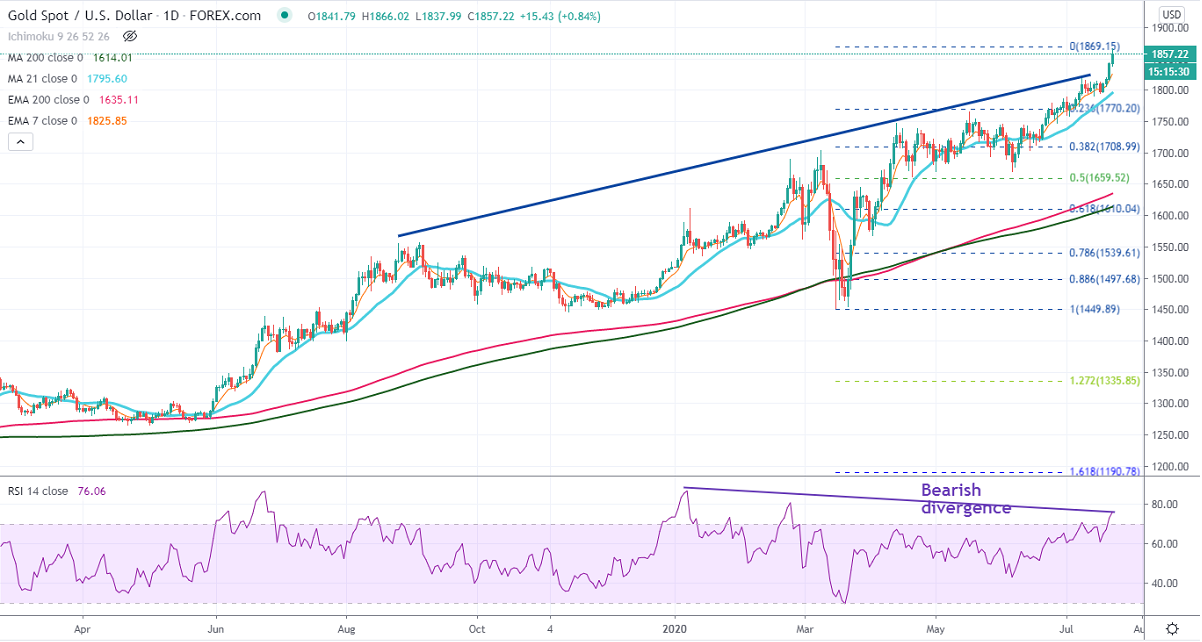
Chart pattern- Bearish Divergence
Ichimoku Analysis ( Daily Chart)
Tenken-Sen- $1813
Kijun-Sen- $1807.88
Gold is trading higher and hits 9-year high around $1865 on a weak dollar. US dollar index declined sharply due to a surge in Euro after approval of a 750 billion euro recovery fund. DXY hits 4-1/2 month low around 95.05 and is currently trading around 95.15. Globally total number cases reached 15.09 million, with deaths around 619560.
US Dollar Index – bearish (positive for yellow metal)
S&P500- bullish (positive for gold)
US Bond yield- sideways (neutral for gold)
Technical:
The yellow metal's near term resistance is around $1860 (161.8% fib), the violation above confirms bullish continuation. A jump till $1890/$1900 likely
The immediate support is around $1825 (7-day EMA), any indicative break beneath targets $1810/ $1790/$1783/$1770 (23.6% fib).
It is good to sell on rallies around $1858-60 with SL around $1867 for the TP at $1800.


