


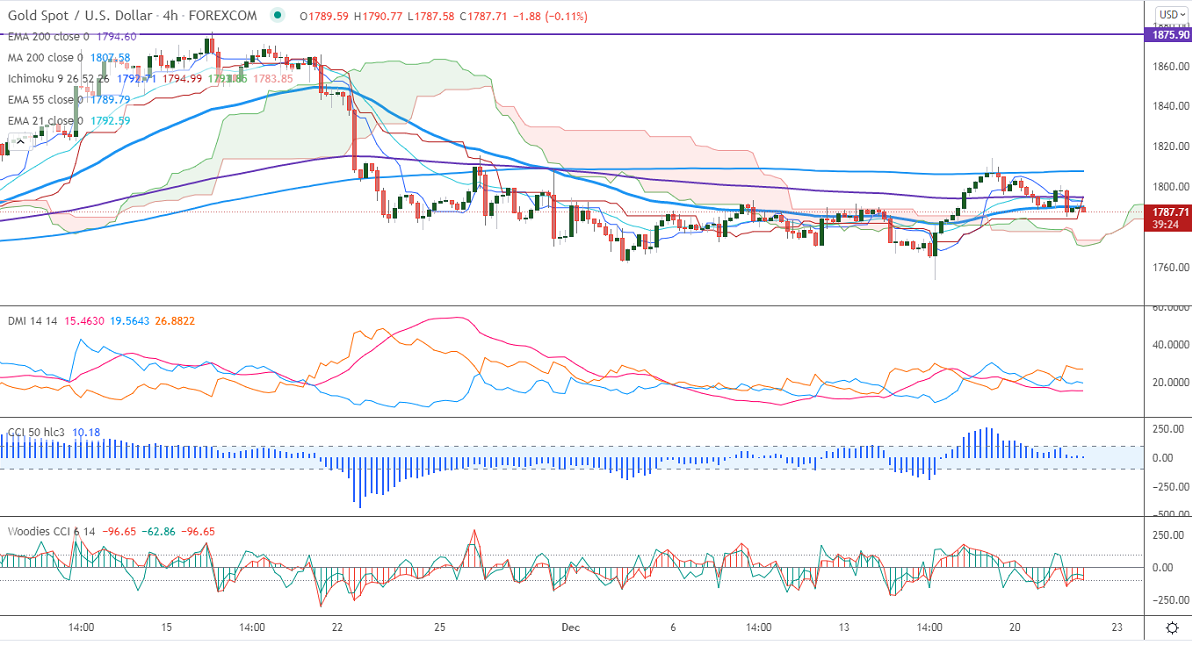
Ichimoku analysis (4-hours chart)
Tenken-Sen- $1792.71
Kijun-Sen- $1783.45
Gold is trading weak for the past four weeks on hawkish Central bank policy. The jump in US dollar and treasury yield is putting pressure on the yellow metal at higher levels. Markets eye US Consumer confidence and existing home sales for further direction. It hits an intraday high of $1791.25 and is currently trading around $1788.65.
The US dollar index is holding above 96.50 levels. Any breach above 97 confirms further bullishness.
Factors to watch for gold price action-
Global stock market- Bullish (Negative for gold)
US dollar index –Bullish (negative for gold)
US10-year bond yield- Bullish (negative for gold)
Technical:
It faces strong support at $1780, violation below targets $1770/$1750/$1740/$1700.Significant trend continuation only below $1675. The yellow metal facing strong resistance $1815, any violation above will take to the next level $1835/$1860/$1900 is possible.
It is good to sell on rallies around $1801-02 with SL around $1815 for TP of $1760.


