


As stated in our previous post, gold bears paving way for fresh longs, bulls are prolonging their business in the bullion market. The recent highs of $1,818 level is on the verge of hitting 9-years highs.
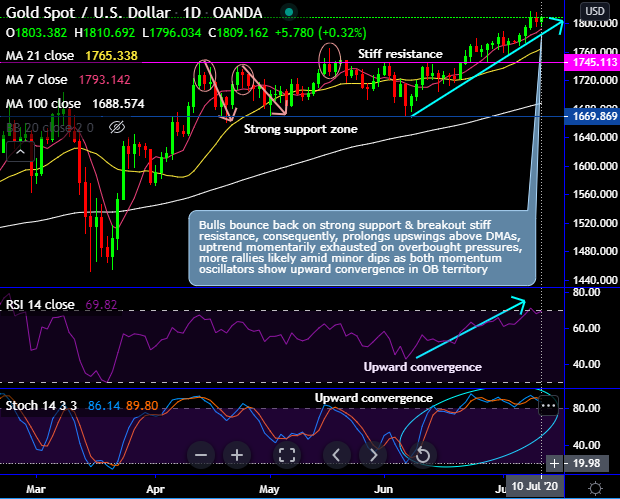
The gold price has been surging above $1,800 levels, the resurgence of precious yellow metal is considerable from the last three and a half months, especially after the test of strong support zone of $1,669.869 levels in the recent past.
Technically, on XAUUSD (Gold) price chart, bulls have bounced back upon the strong support of $1,669 levels, consequently, prolongs upswings above DMAs & managed to breakout stiff resistance zone of $1,745 levels.
The minor uptrend seems momentarily exhausted on the overbought pressures signalled by the leading oscillators (RSI & stochastic curves), but more rallies are likely amid minor dips as these both momentum oscillators show upward convergence in overbought territory (refer daily chart).
While on the contrary, flurry of bearish candles pop-up at the stiff resistance of $1,745 areas (Shooting Stars, Hanging Man & Spinning Top) pop-up at this stiff resistance zone, these bearish patterns coupled with the overbought pressures signal exhausted buying sentiments at this juncture. Hence, gold price has been volatile from the last two months or so.
For now, although we observe the intraday supports of 1,723.800 (21-DMAs) & 1,710.200 levels (7-DMAs), more rallies or renewed bullishness can only be seen on decisive break-out of the stiff resistance.
On a broader perspective, the major uptrend extends through saucer pattern (refer monthly chart).
Bulls break-out stiff resistances of 1,705.56 level (i.e. 88.6% Fibonacci level) of December 2015 lows of (i.e. 1044.62) and October 2012 highs of (1922.88) as hammer counters at saucer (i.e. near double top neckline), the current prices spike off well above EMAs with bullish crossovers, the major uptrend is most likely to prolong saucer pattern upon bullish EMA & MACD crossovers, while both the leading oscillators substantiate the buying sentiments on this timeframe as well.
Trade tips:
At spot reference: $1,808. level (while articulating), on trading grounds, boundary options trading strategy with upper strikes at $1,825 and lower strikes at $1,793 levels. The strategy is most likely fetch assured yields as long as the underlying spot price remains between these two strikes on the expiration.
Alternatively, on hedging grounds, we advocated long positions CME gold contracts of July’2020 delivery as we could foresee more upside risks and intensified buying interests on safe-haven sentiments amid geopolitical turmoil and the global financial crisis.


