


The precious metal (gold) price gains considerably from last couple of days, especially after testing the strong support at $1,547 levels). But to begin this week, these price gains have been pared with profit booking sentiments.
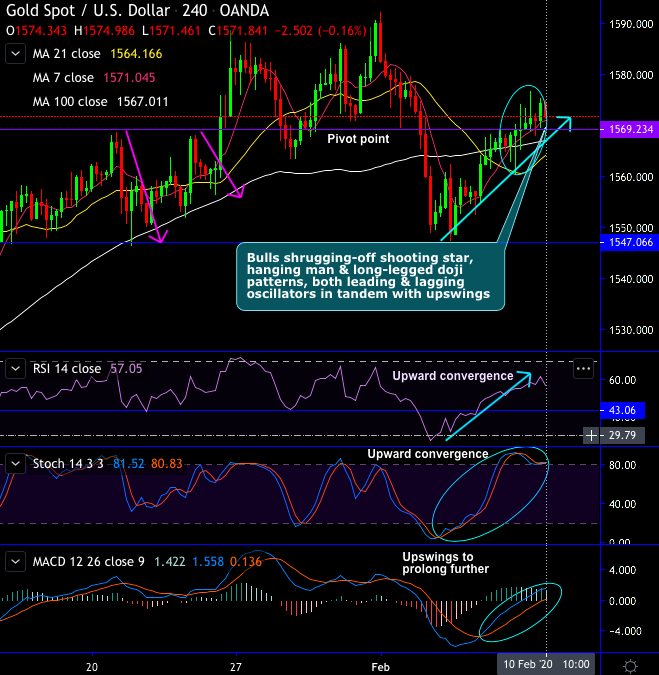
Technically, XAUUSD (Gold) price chart forms shooting star, hanging man & long-legged doji patterns at peaks of rallies or at pivot point (refer oval shaped area in the daily chart). The minor trend has been appear to be shrugging-off these bearish patterns.
Consequently, the current price continue to spike further above 7 & 21-DMAs despite todays price dips. Prior to which, as stated before in our recent post, bulls shrugged-off gravestone doji patterns pop-up at stiff resistance and extended the uptrend above DMAs, dragonfly doji counters with stern rallies.
On a broader perspective, Bulls break-out stiff resistances of 1511.36 level (i.e. 61.8% Fibonacci level) and retraces almost 78.6% of December 2015 lows of (i.e. 1044.62) and August 2011 highs of (1922.88) as hammer counters at saucer (i.e. near double top neckline), the current prices spike off well above EMAs with bullish crossovers, the major uptrend is most likely to prolong on bullish EMA & MACD crossovers, while both the leading oscillators substantiate the buying sentiments.
Trade tips:
At spot reference: $1,572 level, on trading grounds, boundary options trading strategy with upper strikes at 1576.86 and lower strikes at 1568.69 levels. Achieve certain yields as long as the underlying spot FX remains between these two strikes on the expiration.
Alternatively, on hedging grounds, we advocated long positions CME gold contracts of 2019 deliveries. We again upheld the same strategy by rolling over the contracts for March’2020 delivery as we could foresee more upside risks and intensified buying interests on safe-haven sentiments amid geopolitical turmoil and the global financial crisis.


