


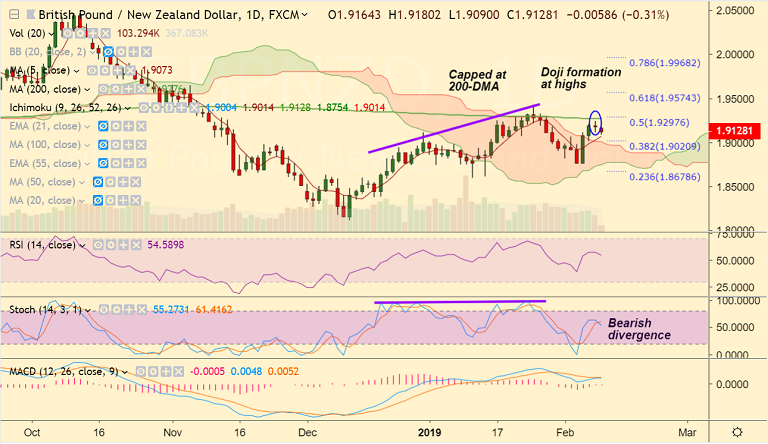
GBP/NZD chart on Trading View used for analysis
- GBP/NZD extends weakness after Doji formation at highs, trades 0.32% lower on the day at 1.9125 at 0845 GMT.
- Upside in the pair was capped shy of 200-DMA, we see further upside only on break above.
- Focus on UK gross domestic product (GDP) for the last quarter of 2018 and December’s manufacturing production data due later today.
- Analysts expect Britain’s quarterly pace of UK economic growth to have decelerated into year end.
- Sterling markets will also remain sensitive to any Brexit headlines, for cues on the prospect of a renegotiated deal being reached.
- Immediate support lies at 5-DMA at 1.9072, break below could see further weakness.
- On the flipside, 200-DMA is major resistance, break above could see further upside.
Support levels - 1.9104 (110-EMA), 1.9076 (5-DMA), 1.9020 (38.2% Fib)
Resistance levels - 1.9277 (200-DMA), 1.9297 (50% Fib), 1.9425 (Jan 25 high)
For details on FxWirePro's Currency Strength Index, visit http://www.fxwirepro.com/currencyindex.


