


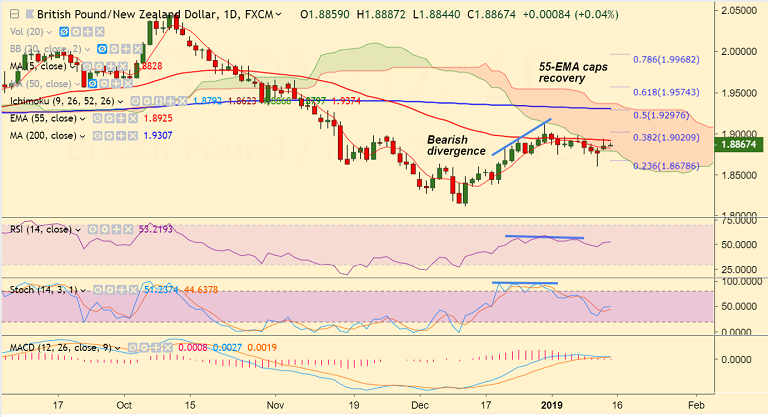
GBP/NZD chart on Trading View used for analysis
- GBP/NZD extends sideways grind, trades rangebound on the day at 1.8869 at 0525 GMT.
- The pair has bounced off lows with a hammer formation and price action has broken into daily cloud.
- The pair trades with a bearish bias and recovery attempts capped at 55-EMA.
- We also evidence a bearish divergence on RSI and Stochs which adds to the bearish bias.
- Breakout above 55-EMA could see some upside. Scope for test of 200-DMA at 1.9307.
- Resumption of weakness could see dip till 1.81252 (Dec 12 low).
- Price action has been rejected at daily cloud, dip till lower Bollinger Band at 1.8435 likely.
Support levels - 1.8677 (4H 200 SMA), 1.8625 (Nov 16 low), 1.8435 (Lower BB)
Resistance levels - 1.8792 (21-EMA), 1.8833 (5-DMA), 1.8927 (55-EMA)
For details on FxWirePro's Currency Strength Index, visit http://www.fxwirepro.com/currencyindex.


