


GBP/CHF chart - Trading View
Technical Analysis: Bias Bullish
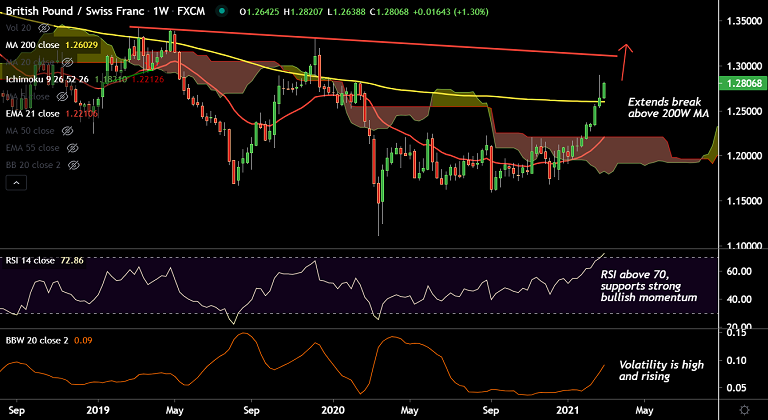
- GBP/CHF extends break above 200W MA
- Momentum strongly bullish, RSI above 70
- Volatility is high and rising as evidenced by widening Bollinger bands
- The pair is on an upward spiral for the 7th consecutive week
- Analysis of GMMA indicator shows major and minor trend are strongly bullish
Support levels - 1.2718 (5-DMA), 1.27 (200H MA), 1.2603 (200W MA)
Resistance levels - 1.28 (55-month EMA), 1.29 (2021 high till date), 1.3060 (88.6% Fib), 1.3125 (trendline)
Summary: GBP/CHF has seen multiple rejection at 55-month EMA. The pair is currently testing resistance at 55-month EMA at 1.28. Decisive break above is required for upside continuation. Technical indicators support gains. Scope for test of 1.36 levels.


