


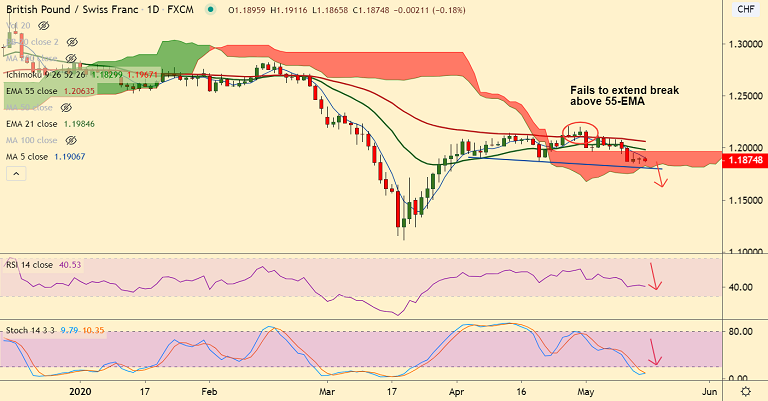
GBP/CHF chart - Trading View
Technical Analysis: Bias Bearish
GMMA Indicator
- Major Trend: Bearish
- Minor Trend: Bearish
Ichimoku Analysis
- Price action has dipped into daily cloud
- Bearish Tenkan Sen crossover below Kjun Sen adds to the bearish bias
Oscillators
- RSI is below 50 and poised for further downside
- Stochs are in oversold zone, but no major signs of reversal seen
Bollinger Bands
- Bollinger Bands are widening on the daily charts
- Rising volatility could drag prices lower
High/Low:
- Previous Week High/Low - 1.2120/ 1.1963
- Previous Session High/Low - 1.1909/ 1.1852
Major Support Levels: 1.1844 (Lower BB), 1.1820 (trendline), 1.1675 (Aug 2019 low)
Major Resistance Levels: 1.1912 (50-DMA), 1.2011 (20-DMA), 1.2063 (55-EMA)
Summary: GBP/CHF is sliding lower after failure to extend break above 55-EMA. Technical analysis supports weakness. The pair is extending sideways for the third straight session. Watch out for break below 1.1820 to go short, target 1.17, Stop Loss 1.19.


