


GBP/CAD chart - Trading View
Technical Analysis: Bias Bullish
- GBP/CAD is extending upside for the 3rd straight session
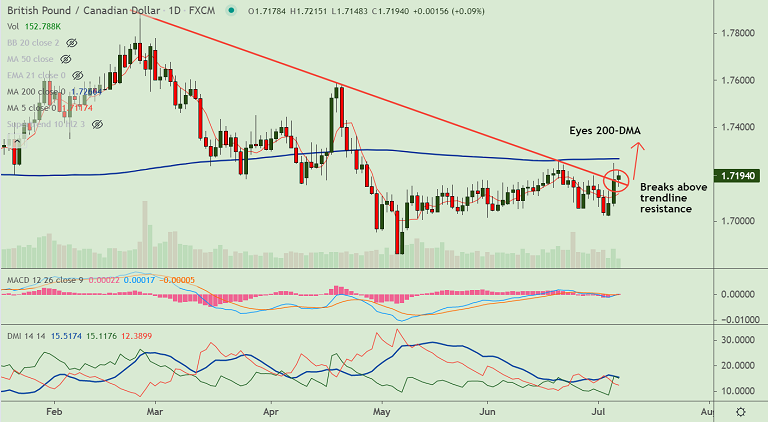
- Price action has broken strong trendline resistance at 1.7175
- The pair has ignored 'Inverted Hammer' formation on previous week's candle
- Price action has retraced dip below 200-week MA, pair is now trading above 200H MA
- GMMA indicator shows near-term bias has turned bullish
Support levels - 1.7169 (Trendline), 1.7156 (55-EMA), 1.7120 (200H MA)
Resistance levels - 1.7207 (110-EMA), 1.7266 (200-DMA), 1.7298 (Weekly cloud top)
Summary: The British pound gained some positive traction on Wednesday amid optimism over the easing of COVID-19 restrictions in the UK.
Technical bias for the pair is turning bullish after breakout at major trendline resistance at 1.7175. The pair is on track to test 200-DMA at 1.7266. Breakout at 200-DMA will fuel further gains.


